USO 13-day bullish forecast — Nov 1, 2026
- Bias: Bullish
- Timeframe: 13 days (made Nov 1, 2026, target date Nov 13, 2026)
- Price at analysis: $168.82
- Price target: $171.50
- Expected range: $162.00 – $175.50
- Result: Incorrect (-13.7%) — closed at $145.64 on Nov 13, 2026; quality score 0/100
Get a free AI analysis of USO today
Analysis
TECHNICAL INDICATORS
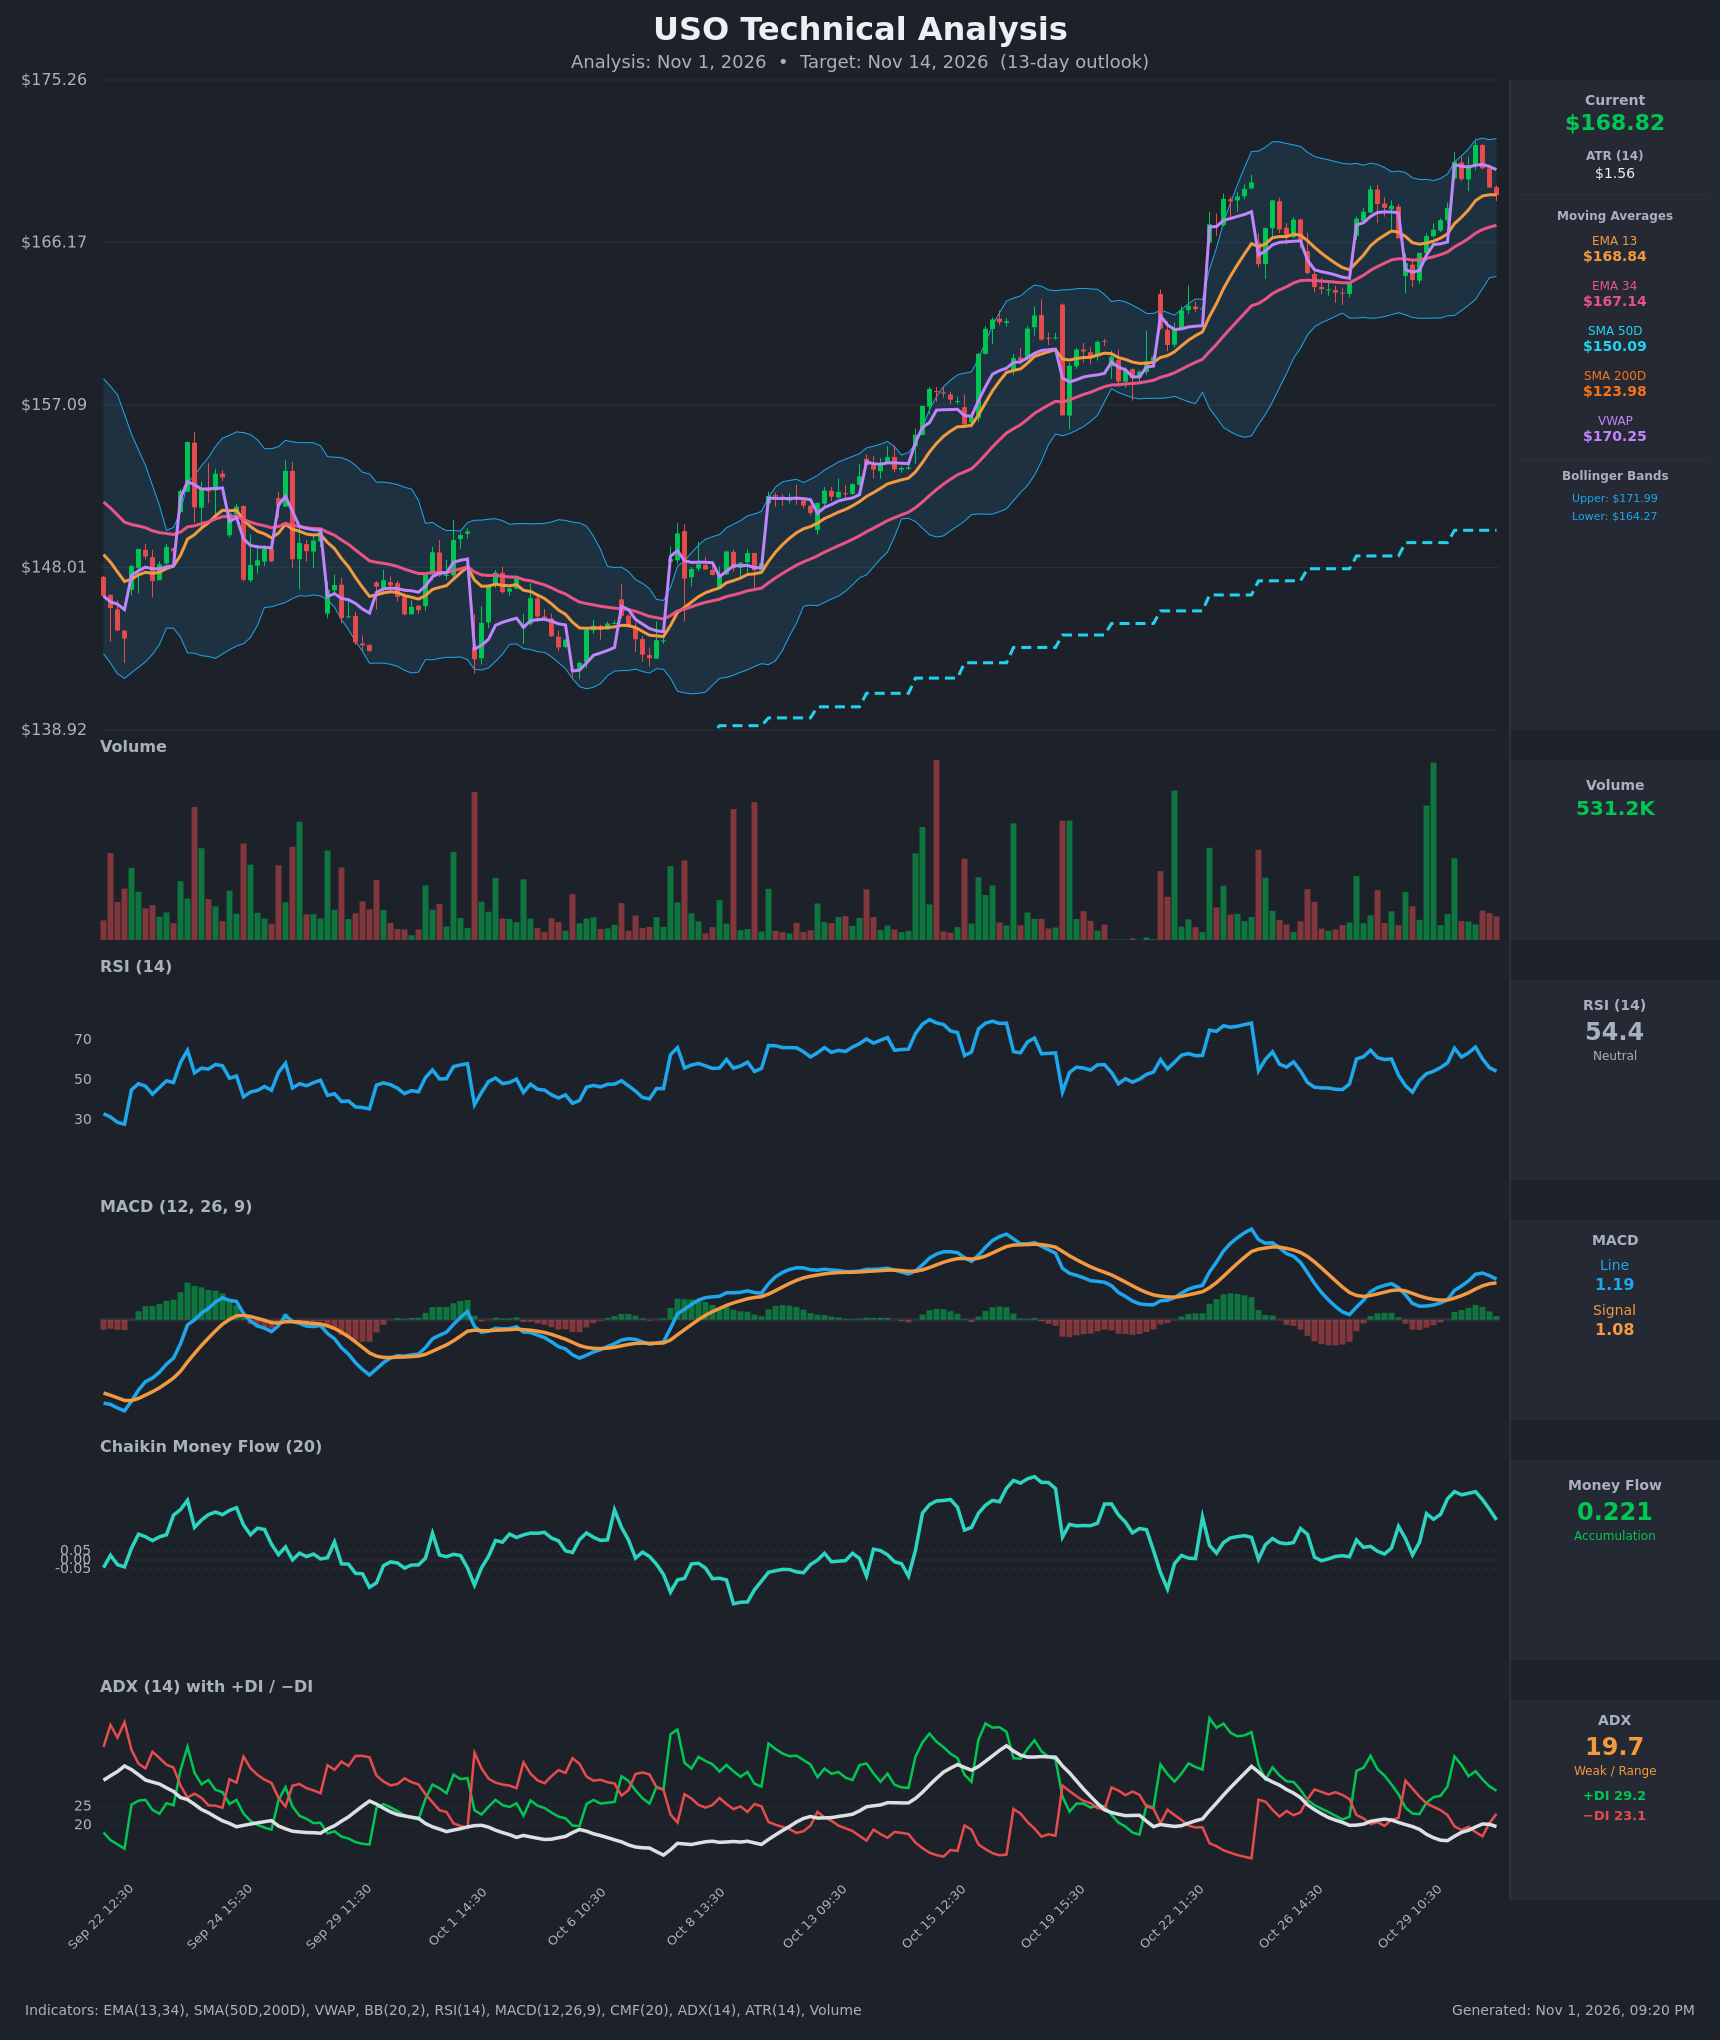
- RSI (14): 54.41, down from a 66.5 peak on Oct 30 and drifting back toward the midline. It has not reached overbought and still sits in a healthy uptrend zone. Short-term momentum is cooling. [Neutral]
- 20 EMA (EMA 13/34 used): EMA13 is $168.84 and EMA34 is $167.14. Price at $168.82 is sitting right on EMA13, with EMA34 about 1% below as the next support. EMA13 is above EMA34, so the short-term trend is intact, and the gap has widened over the past two weeks. [Bullish]
- MACD: Line 1.188 is above Signal 1.081, with a small positive histogram of about +0.11. The line peaked at 1.369 and is rolling over, so the histogram is narrowing. A bearish cross is not imminent, but momentum is fading. [Bullish]
- Bollinger Bands (20): Upper $171.99, lower $164.27, middle roughly $168.1. Price is just above the midline after riding the upper band to $171.62. The bands are moderately wide, so volatility has expanded. A pullback to the midline within an uptrend is typical. [Bullish]
- CMF (20): 0.221, well above +0.05, and positive for most of the past month with a peak near 0.38. Buying pressure persists even during the pullback. [Accumulation]
- ADX (14): 19.7 with +DI 29.2 above −DI 23.1. ADX is below 20, so trend strength is weak, but the DI spread still favors bulls. The −DI spike on Oct 29 was quickly reversed. [Weak Trend, bullish direction]
- Volume: 531.2K, modest compared with the large spikes seen on breakouts. The recent down bars are on light volume, so the pullback shows no heavy distribution. [Neutral to mildly bullish]
DIVERGENCES & TRENDS
- Price made higher highs ($171.62) while RSI made a lower high (66.5 versus the 70+ readings in mid-October). This is a mild bearish momentum divergence against the October highs.
- MACD peaked at 1.369 and is falling toward the signal line, while price is still near its highs. This is a minor warning, not a confirmed divergence.
- CMF is making higher readings, so volume-weighted flow supports price.
- Price is above the SMA50 ($150.09) and SMA200 ($123.98). The golden cross is long established, and the 50-day is rising steadily, so the long-term trend is strongly up.
- Price is below VWAP ($170.25) after an Oct 30 rejection from $171.62, so intraday buyers are slightly underwater.
- ADX near 19–20 and falling from its Oct 22 peak suggests the trend is pausing and consolidating rather than reversing.
CHART PATTERNS
- Rising staircase / ascending channel: Higher highs and higher lows since early October, with price holding above EMA34. This is the dominant structure.
- Bullish flag / ascending-triangle-like consolidation (reference diagram): Price is consolidating between about $164 and $171.6 after the sharp Oct 30 gap higher. A break above $171.6–172 would target a measured move of about $175–177.
- Possible minor double top (reference diagram, bearish): Highs at $170.68 and $171.62 form a minor double top near $171–172. A close below $167 (EMA34 and neckline) would activate it, with a target near $164 (lower band).
- On balance, the continuation pattern has a slight edge, given the trend, CMF and DI alignment.
POTENTIAL SCENARIOS
- Scenario 1: Bullish Trend Continuation — Price holds the EMA34/midline area, then breaks above the Oct 30 high with CMF still positive. Trigger: close above $172.00 (upper band and recent high). Target: $175–177. Invalidation: close below $166.00. (50% probability)
- Scenario 2: Neutral Range Consolidation — ADX stays weak and price chops between the EMA34 and the upper band. Trigger: failed breakouts on both sides, with RSI oscillating at 45–60. Target: $166–171. Invalidation: close above $172.50 or below $164.00. (25% probability)
- Scenario 3: Bearish Pullback — The RSI divergence and the minor double top play out, and the MACD crosses below its signal. Trigger: close below $167.14 (EMA34) on rising volume. Target: $164.30 (lower band), then $162. Invalidation: reclaim of $170.30 (VWAP). (25% probability)
PRICE TARGETS
- Target Price: $171.50 (13-day horizon)
- Expected Range: $162.00 to $175.50 (width $13.50, about 8.0% of current price, consistent with a 13-day horizon; roughly 8.6 ATRs)
- Key Levels: Support at $167.14 (EMA34), with $164.27 (lower Bollinger Band) below it. Resistance at $171.99 (upper Bollinger Band, near the $171.62 recent high).
OVERALL BIAS
OVERALL BIAS: BULLISH - The long-term uptrend is intact, with price above the rising SMA50 and SMA200, EMA13 above EMA34, +DI above −DI, MACD above its signal and CMF showing strong accumulation. The cooling RSI, weak ADX and minor double-top risk near $172 limit conviction to modest.
This is educational analysis and not financial advice.