META 13-day bearish forecast — Nov 1, 2026
- Bias: Bearish
- Timeframe: 13 days (made Nov 1, 2026, target date Nov 13, 2026)
- Price at analysis: $614.98
- Price target: $601.00
- Expected range: $580.00 – $632.00
- Result: Incorrect (+3.6%) — closed at $637.15 on Nov 13, 2026; quality score 35/100
Get a free AI analysis of META today
Analysis
TECHNICAL INDICATORS
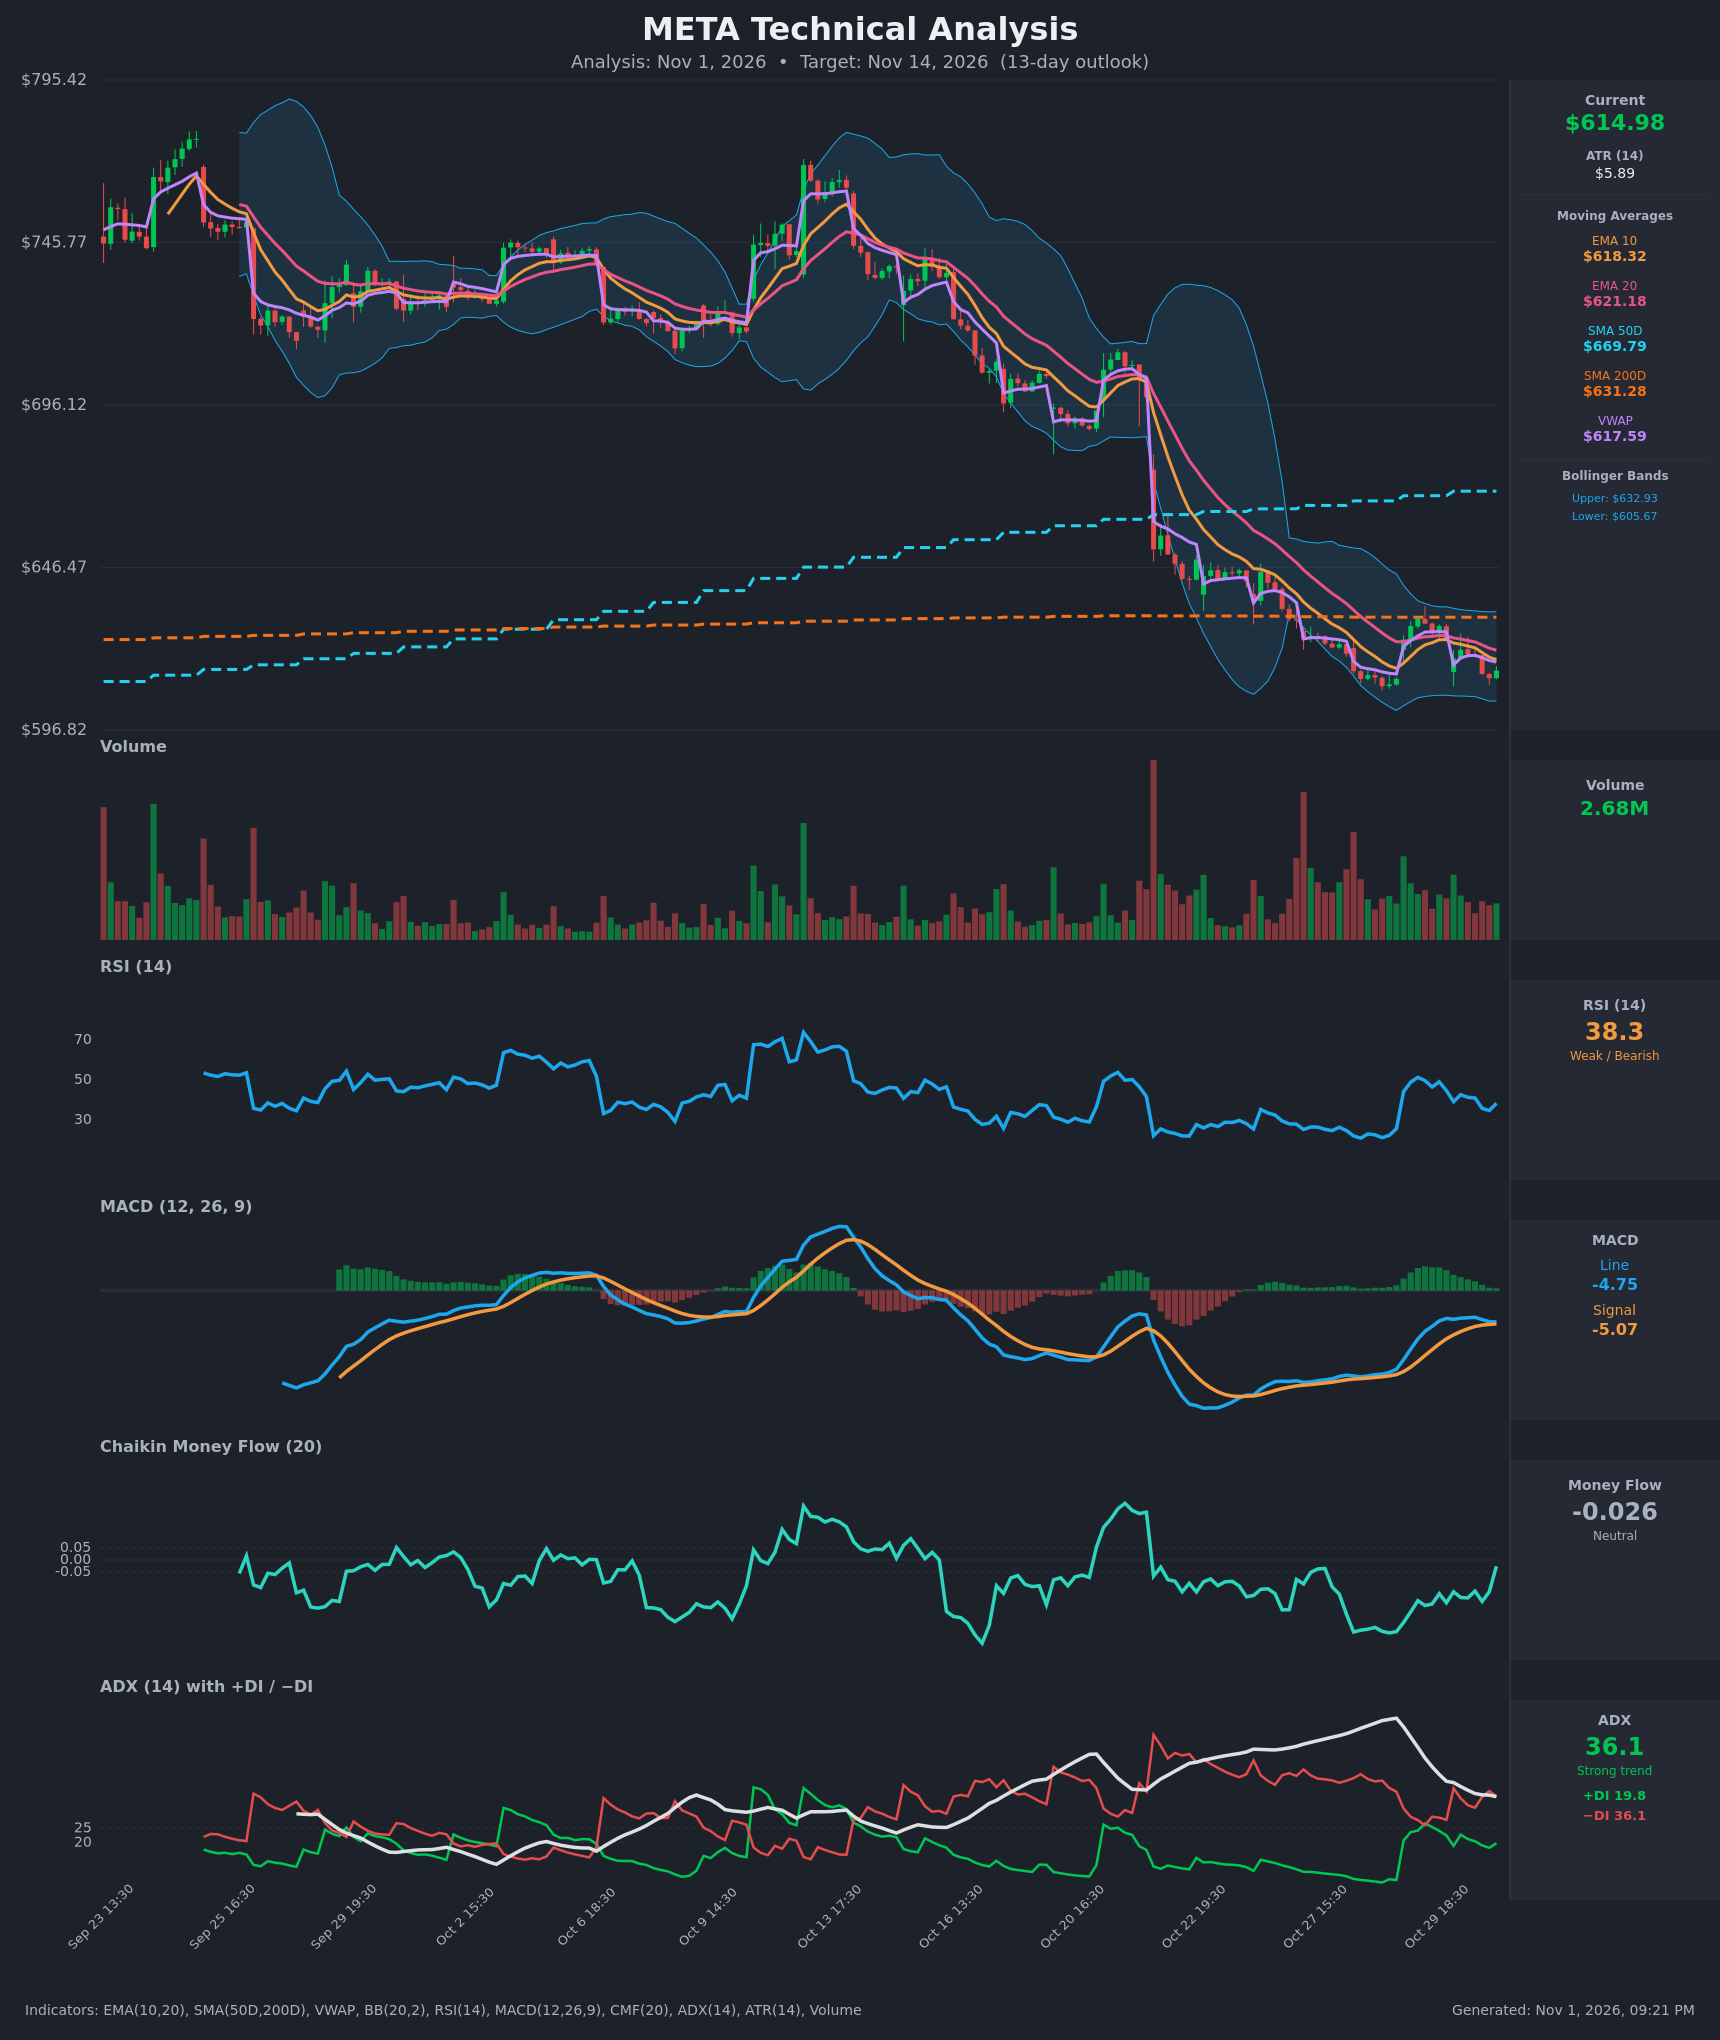
- RSI (14): 38.34, below the 50 midline and recovering from a 25.6 oversold reading on Oct 28. The bounce to ~51 failed, and RSI is rolling over again after touching ~34.7. Momentum is weak with lower highs. [Bearish]
- 20 EMA: $621.18, with price at $614.98 below it. EMA10 ($618.32) is also below EMA20 and both are sloping down. The EMA10/20 bearish stack means the 20 EMA acts as overhead resistance. [Bearish]
- MACD: Line -4.75 vs signal -5.07, so the line is marginally above the signal and the histogram is barely positive (~+0.32). The line has been drifting lower since Oct 29 while the signal converges, and the histogram is shrinking. The positive cross is weak and at risk of flipping back negative. [Neutral]
- Bollinger Bands (20): Upper $632.93, lower $605.67, midline ~$619.30. Price is in the lower half, about 1.6 ATR above the lower band. The bands have narrowed after the big expansion, and price is walking along the lower half. [Bearish]
- CMF (20): -0.026, in the neutral zone (±0.05). It has improved from -0.297 on Oct 28 but remains negative, showing selling pressure easing without real accumulation. [Neutral]
- ADX (14): 36.1 (falling from a ~63 peak), with +DI 19.8 and −DI 36.1. −DI is clearly on top, so the downtrend is still strong even though it is maturing. [Strong Trend – Bearish]
- Volume: 2.68M, average to below average on the recent bounce, with heavy volume on the earlier breakdown. The relief rally had no convincing volume expansion. [Neutral to Bearish – weak bounce]
DIVERGENCES & TRENDS
- Moving averages: Price is below SMA200 ($631.28) after breaking it on the Oct 23 gap-down. SMA50 ($669.79) sits well above and is still rising only because of lagging data. It is likely to roll over and trend toward a death cross with the SMA200. The SMA200 and EMA20 form a resistance cluster at $621–$631.
- VWAP: $617.59 is just above price, which has been below VWAP at most recent closes and signals mild seller control.
- RSI/MACD: No clear bullish divergence. The Oct 28 low at $612.40 saw RSI at 25.6, while the recent low at $612.66 saw RSI at 34.7, a mild bullish RSI divergence. This is a hint of selling exhaustion, but the following bounce failed at lower-high RSI levels.
- ADX: Falling from extremes, which suggests the trend is decelerating. −DI is still far above +DI, so there is no DI crossover.
- Price structure: Lower highs and lower lows since mid-Oct, with a bounce capped near $630.
CHART PATTERNS
- Bearish Flag / Falling Channel (continuation): After the sharp Oct 23 drop from ~$680, price has consolidated in a tight, slightly descending range between ~$612 and ~$631. This resembles a bearish flag or pennant. A break below $612 projects a measured move of roughly $25–$35 (flagpole ~$70, partial), so the target zone is around $580–$590.
- Potential Double Bottom (Bullish Reversal): Lows near $612.40 and $612.66 form a rough double bottom with a neckline at ~$631. It needs a break above the neckline and the SMA200 to confirm, which would target roughly $650.
- The bearish continuation read is slightly favoured, given the strong −DI dominance and price below all key averages.
POTENTIAL SCENARIOS
- Scenario 1: Bearish Flag Breakdown — Price fails at the EMA20/VWAP cluster ($618–$621) and breaks the double-bottom support at ~$612, continuing the downtrend with −DI dominant. Trigger: close below $612 on rising volume. Target: $590–$598. Invalidation: close above $632 (SMA200 and upper BB). (50% probability)
- Scenario 2: Bullish Double-Bottom Relief Rally — The RSI divergence and MACD positive cross lead to a push through the EMA20 and a retest of the SMA200. Trigger: close above $622 with CMF turning above +0.05. Target: $631–$640. Invalidation: close below $610. (30% probability)
- Scenario 3: Neutral Range Chop — Price oscillates between $608 and $628 as ADX continues to cool. Trigger: failure to break either $612 or $628. Target: $612–$625. Invalidation: decisive close outside the range. (20% probability)
PRICE TARGETS
For a 13-day horizon, the expected range width is ~$51 wide at 8–12% guidance... see the calculation: range $580.00 to $632.00 = $52 width, or ~8.5% of the current price. This falls within the 14–21 day guidance of 8–12% and is appropriately wider than a 2–3 day range.
- Target Price: $601.00 (13-day)
- Expected Range: $580.00 to $632.00
- Key Levels: Support at $605.67 (lower Bollinger Band; then $596.82 chart low), Resistance at $621.18 (EMA20; then $631.28 SMA200)
OVERALL BIAS
OVERALL BIAS: BEARISH - Price is below the declining EMA10/20, VWAP and SMA200, ADX of 36 with −DI (36.1) far above +DI (19.8) confirms a strong downtrend, and the bounce has stalled on weak volume. The mild RSI divergence and flat CMF limit conviction, so the downside is expected to be gradual.
This is educational analysis and not financial advice.