INTC 13-day bearish forecast — Nov 1, 2026
- Bias: Bearish
- Timeframe: 13 days (made Nov 1, 2026, target date Nov 13, 2026)
- Price at analysis: $65.84
- Price target: $63.30
- Expected range: $60.20 – $66.80
- Result: Correct (-10.9%) — closed at $58.64 on Nov 13, 2026; quality score 71/100
Get a free AI analysis of INTC today
Analysis
TECHNICAL INDICATORS
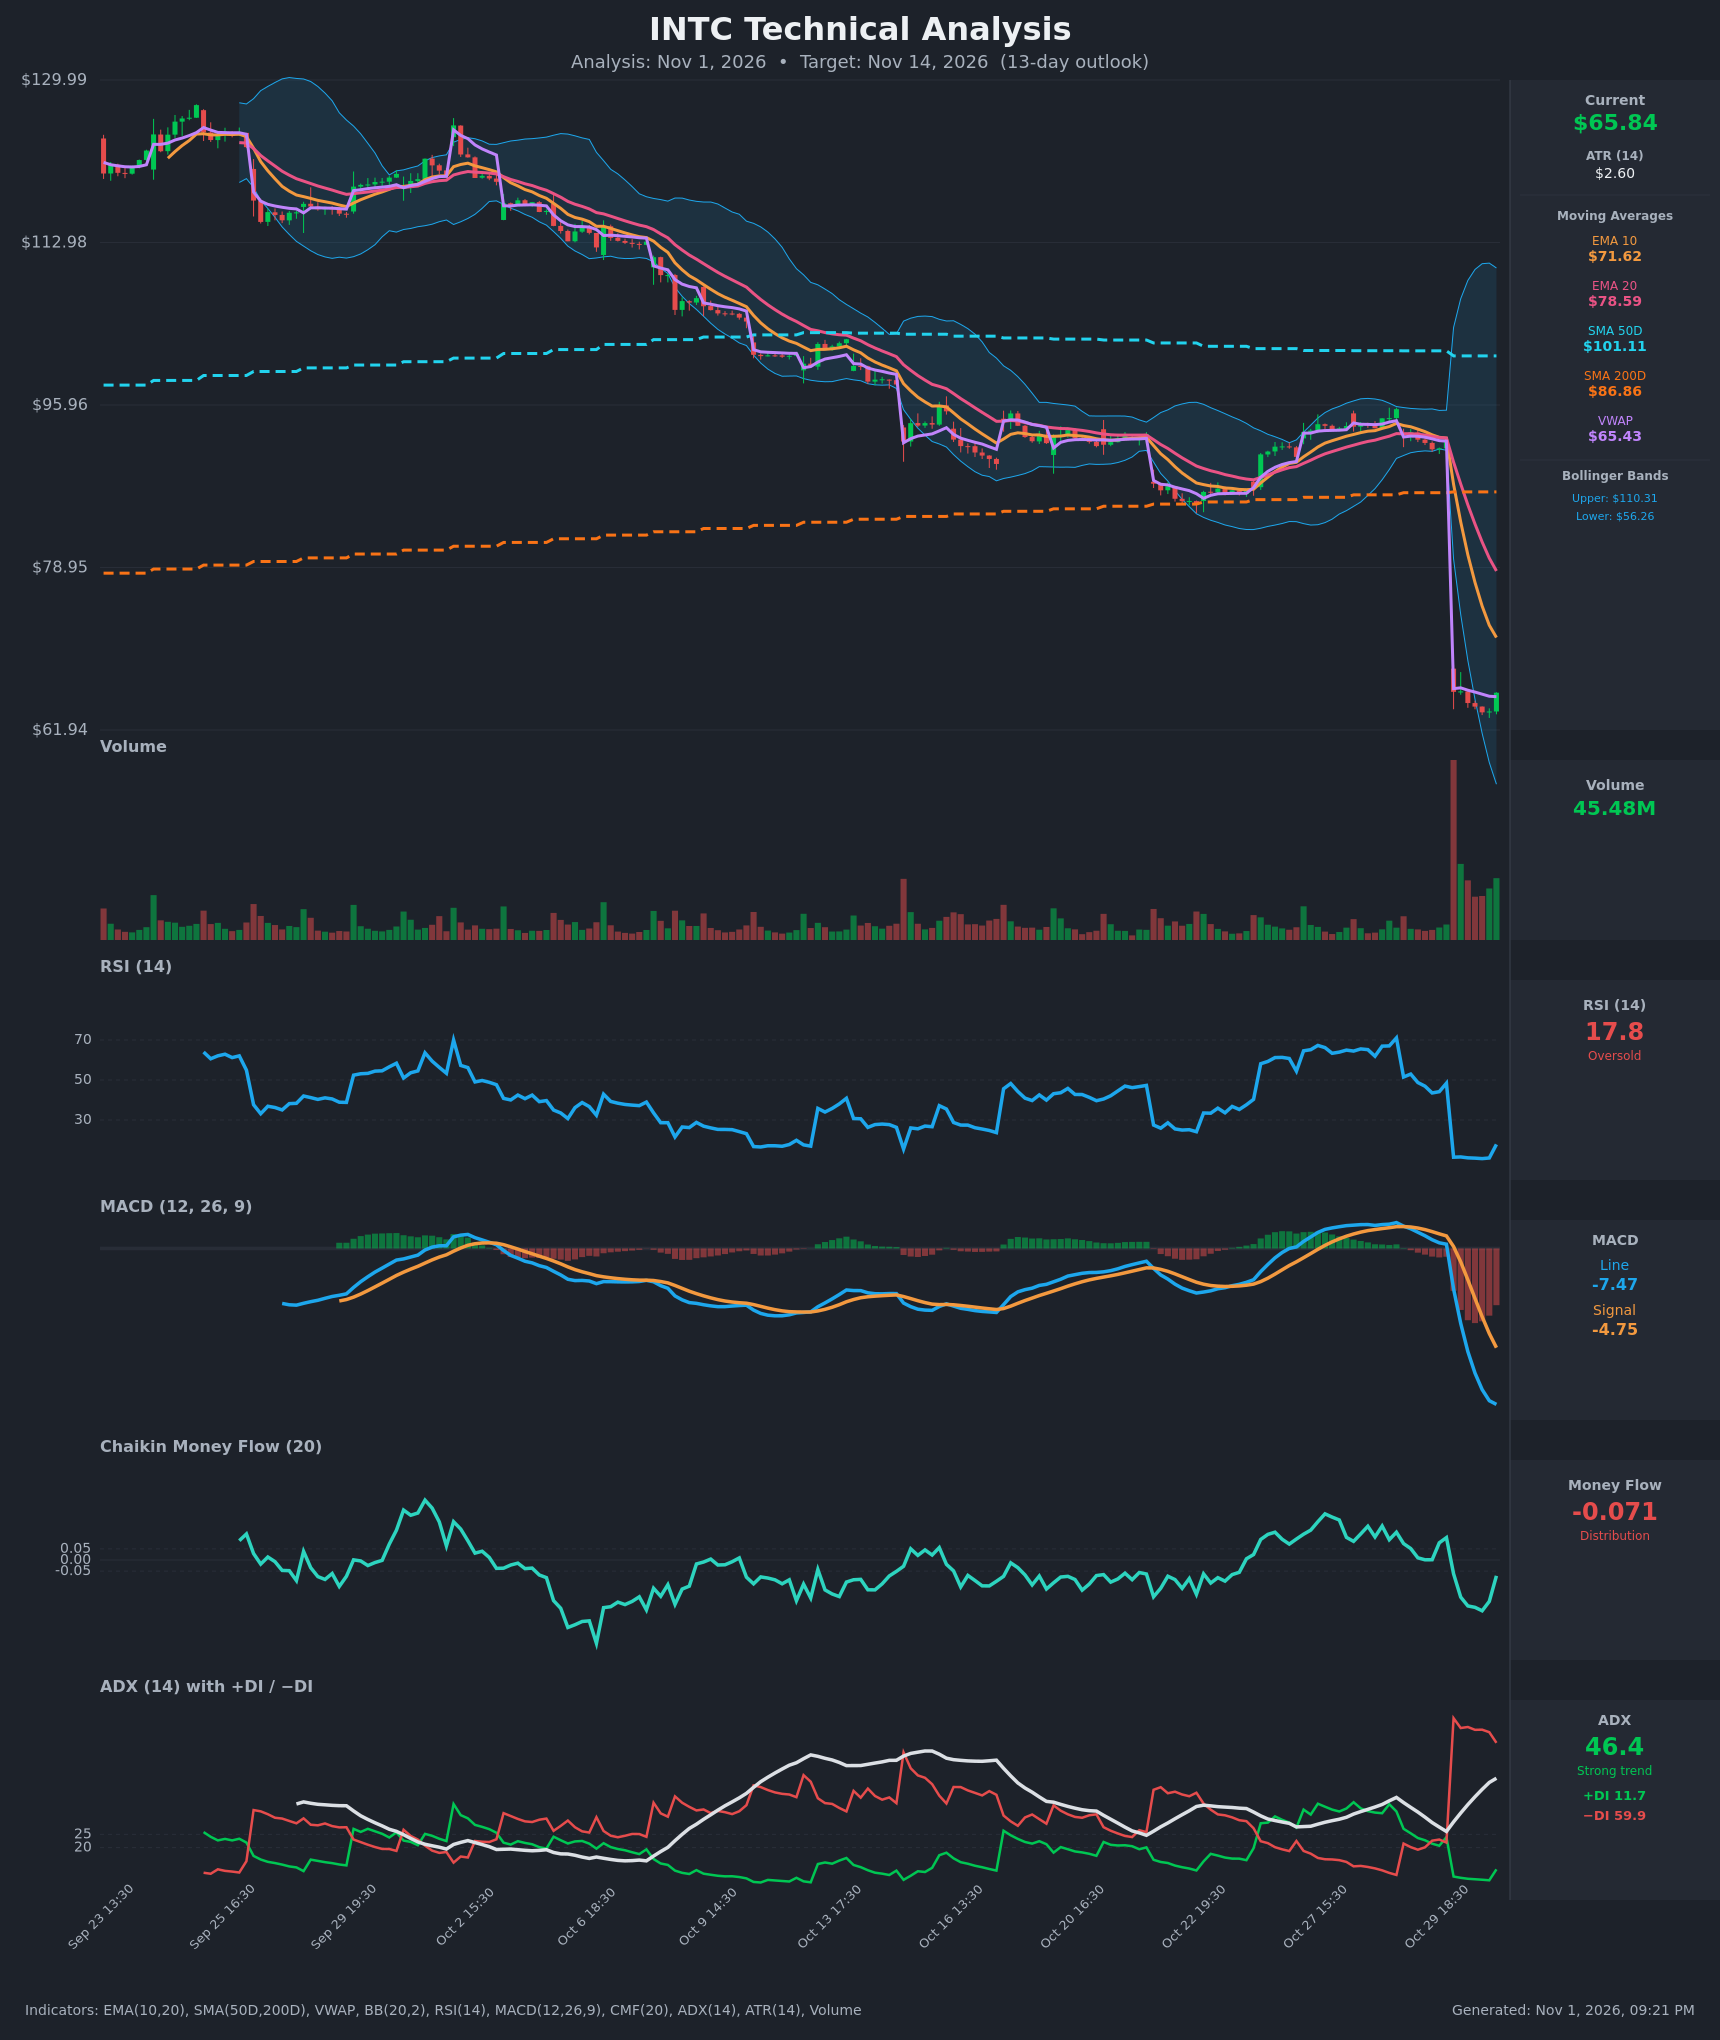
- RSI (14): 17.8, deeply oversold after printing about 10.7 to 11.5 during the post-gap selloff. The last bar ticked up from 11.0, which is a first sign of a relief bounce. Momentum is still historically weak. [Bearish]
- 20 EMA: $78.59, with the 10 EMA at $71.62. Price at $65.84 is well below both and both are falling steeply. EMA10 is below EMA20, and the gap from about $92 down to $65 leaves overhead resistance at $71.6 and $78.6. [Bearish]
- MACD: Line -7.47 is below Signal -4.75, and the bearish cross happened on Oct 30 as the line plunged from +0.2. The histogram is deeply negative and still widening. There is no sign of a momentum turn yet. [Bearish]
- Bollinger Bands (20): Upper $110.31, lower $56.26. The bands are extremely wide after the gap, and price sits in the lower third, about $9.6 above the lower band. It is not an outright band-walk, but the downside volatility expansion is clear. The bands' midline is far above, around $83. [Bearish]
- CMF (20): -0.071, which is distribution. It bottomed near -0.228 and has recovered, so selling pressure is easing, but it is still below the -0.05 threshold. [Distribution]
- ADX (14): 46.4 and rising, with -DI at 59.9 against +DI at 11.7. Bears are firmly in control of a strong downtrend. +DI has ticked up slightly from 7.5, which is a minor improvement. [Strong Trend – Bearish]
- Volume: 45.48M on the latest bar, versus the spike on the gap-down day (the biggest in the chart). Elevated volume is continuing after the gap. The last candle is green, which suggests some dip-buying, but the selling volume was far larger. [Capitulation / Distribution, with early bounce attempt]
DIVERGENCES & TRENDS
- There is no confirmed bullish divergence yet. RSI and price both made new lows together, and the RSI uptick to 17.8 is only a one-bar bounce.
- The 50-day SMA ($101.11) is above the 200-day SMA ($86.87), so there is no death cross yet. Price is now below both, which signals a long-term trend break.
- A gap-down of about 28% (from $92.08 to $65.93) broke the Oct 22–29 recovery range. Price is hugging the post-gap VWAP at $65.43 and sits just above it.
- CMF and +DI are improving from extremes, which shows selling exhaustion. Trend indicators (MACD, ADX, MAs) have not turned.
- The MACD histogram is still expanding to the downside, so no momentum base has formed.
CHART PATTERNS
- The chart shows a large down-gap after a Bearish Double Top / failed recovery in the $92–95 zone. The Oct 22–29 rally stalled at the Oct 28 high and then collapsed.
- The post-gap action, with a small base around $63.8 to $66 and a possible small bounce, could form a Bearish Flag/Pennant if it stays within a narrow range. The measured move from a break lower would project toward $58–60, near the lower Bollinger Band at $56.26.
- A relief rally into the $68–72 gap/EMA10 zone would be a corrective bounce, not a reversal, unless price reclaims $78.6 (EMA20).
POTENTIAL SCENARIOS
- Scenario 1: Bearish Continuation / Flag Breakdown — Price rallies weakly or chops under the gap, then breaks the post-gap lows as trend momentum (ADX 46, -DI 60) reasserts. Trigger: close below $63.80, then below $62.00. Target: $60.00 to $58.00 (toward the lower BB at $56.26). Invalidation: close above $68.00. (45% probability)
- Scenario 2: Bullish Oversold Relief Bounce — RSI at 17.8 mean-reverts, CMF turns positive, and price recovers toward the falling EMA10 and the gap zone. Trigger: close above $68.00 on rising volume. Target: $71.60 (EMA10), with an extension to $75. Invalidation: loss of $62.00. (35% probability)
- Scenario 3: Neutral Base-Building Consolidation — Price chops between $62 and $68 around VWAP while volatility compresses after the shock. Trigger: low-volume overlapping candles near $65. Target: $64–67. Invalidation: close outside $62–$68. (20% probability)
PRICE TARGETS
- Target Price: $63.30 (13-day horizon)
- Expected Range: $60.20 to $66.80 (width $6.60, about 10.0% of the current price, consistent with a ~13-day horizon)
- Key Levels: Support at $62.00, Resistance at $68.00
OVERALL BIAS
OVERALL BIAS: BEARISH - Price is below all key moving averages after a large gap-down. MACD and ADX are both bearish, with -DI at 59.9 against +DI at 11.7, and CMF still shows distribution. The extreme oversold RSI makes a relief bounce likely, but a bounce into $68–72 would likely meet heavy overhead supply, so the net 13-day expectation is slightly lower.
This is educational analysis and not financial advice.