MU 13-day bearish forecast — Nov 1, 2026
- Bias: Bearish
- Timeframe: 13 days (made Nov 1, 2026, target date Nov 13, 2026)
- Price at analysis: $884.69
- Price target: $865.00
- Expected range: $826.00 – $908.00
- Result: Correct (-13.9%) — closed at $761.65 on Nov 13, 2026; quality score 50/100
Get a free AI analysis of MU today
Analysis
TECHNICAL INDICATORS
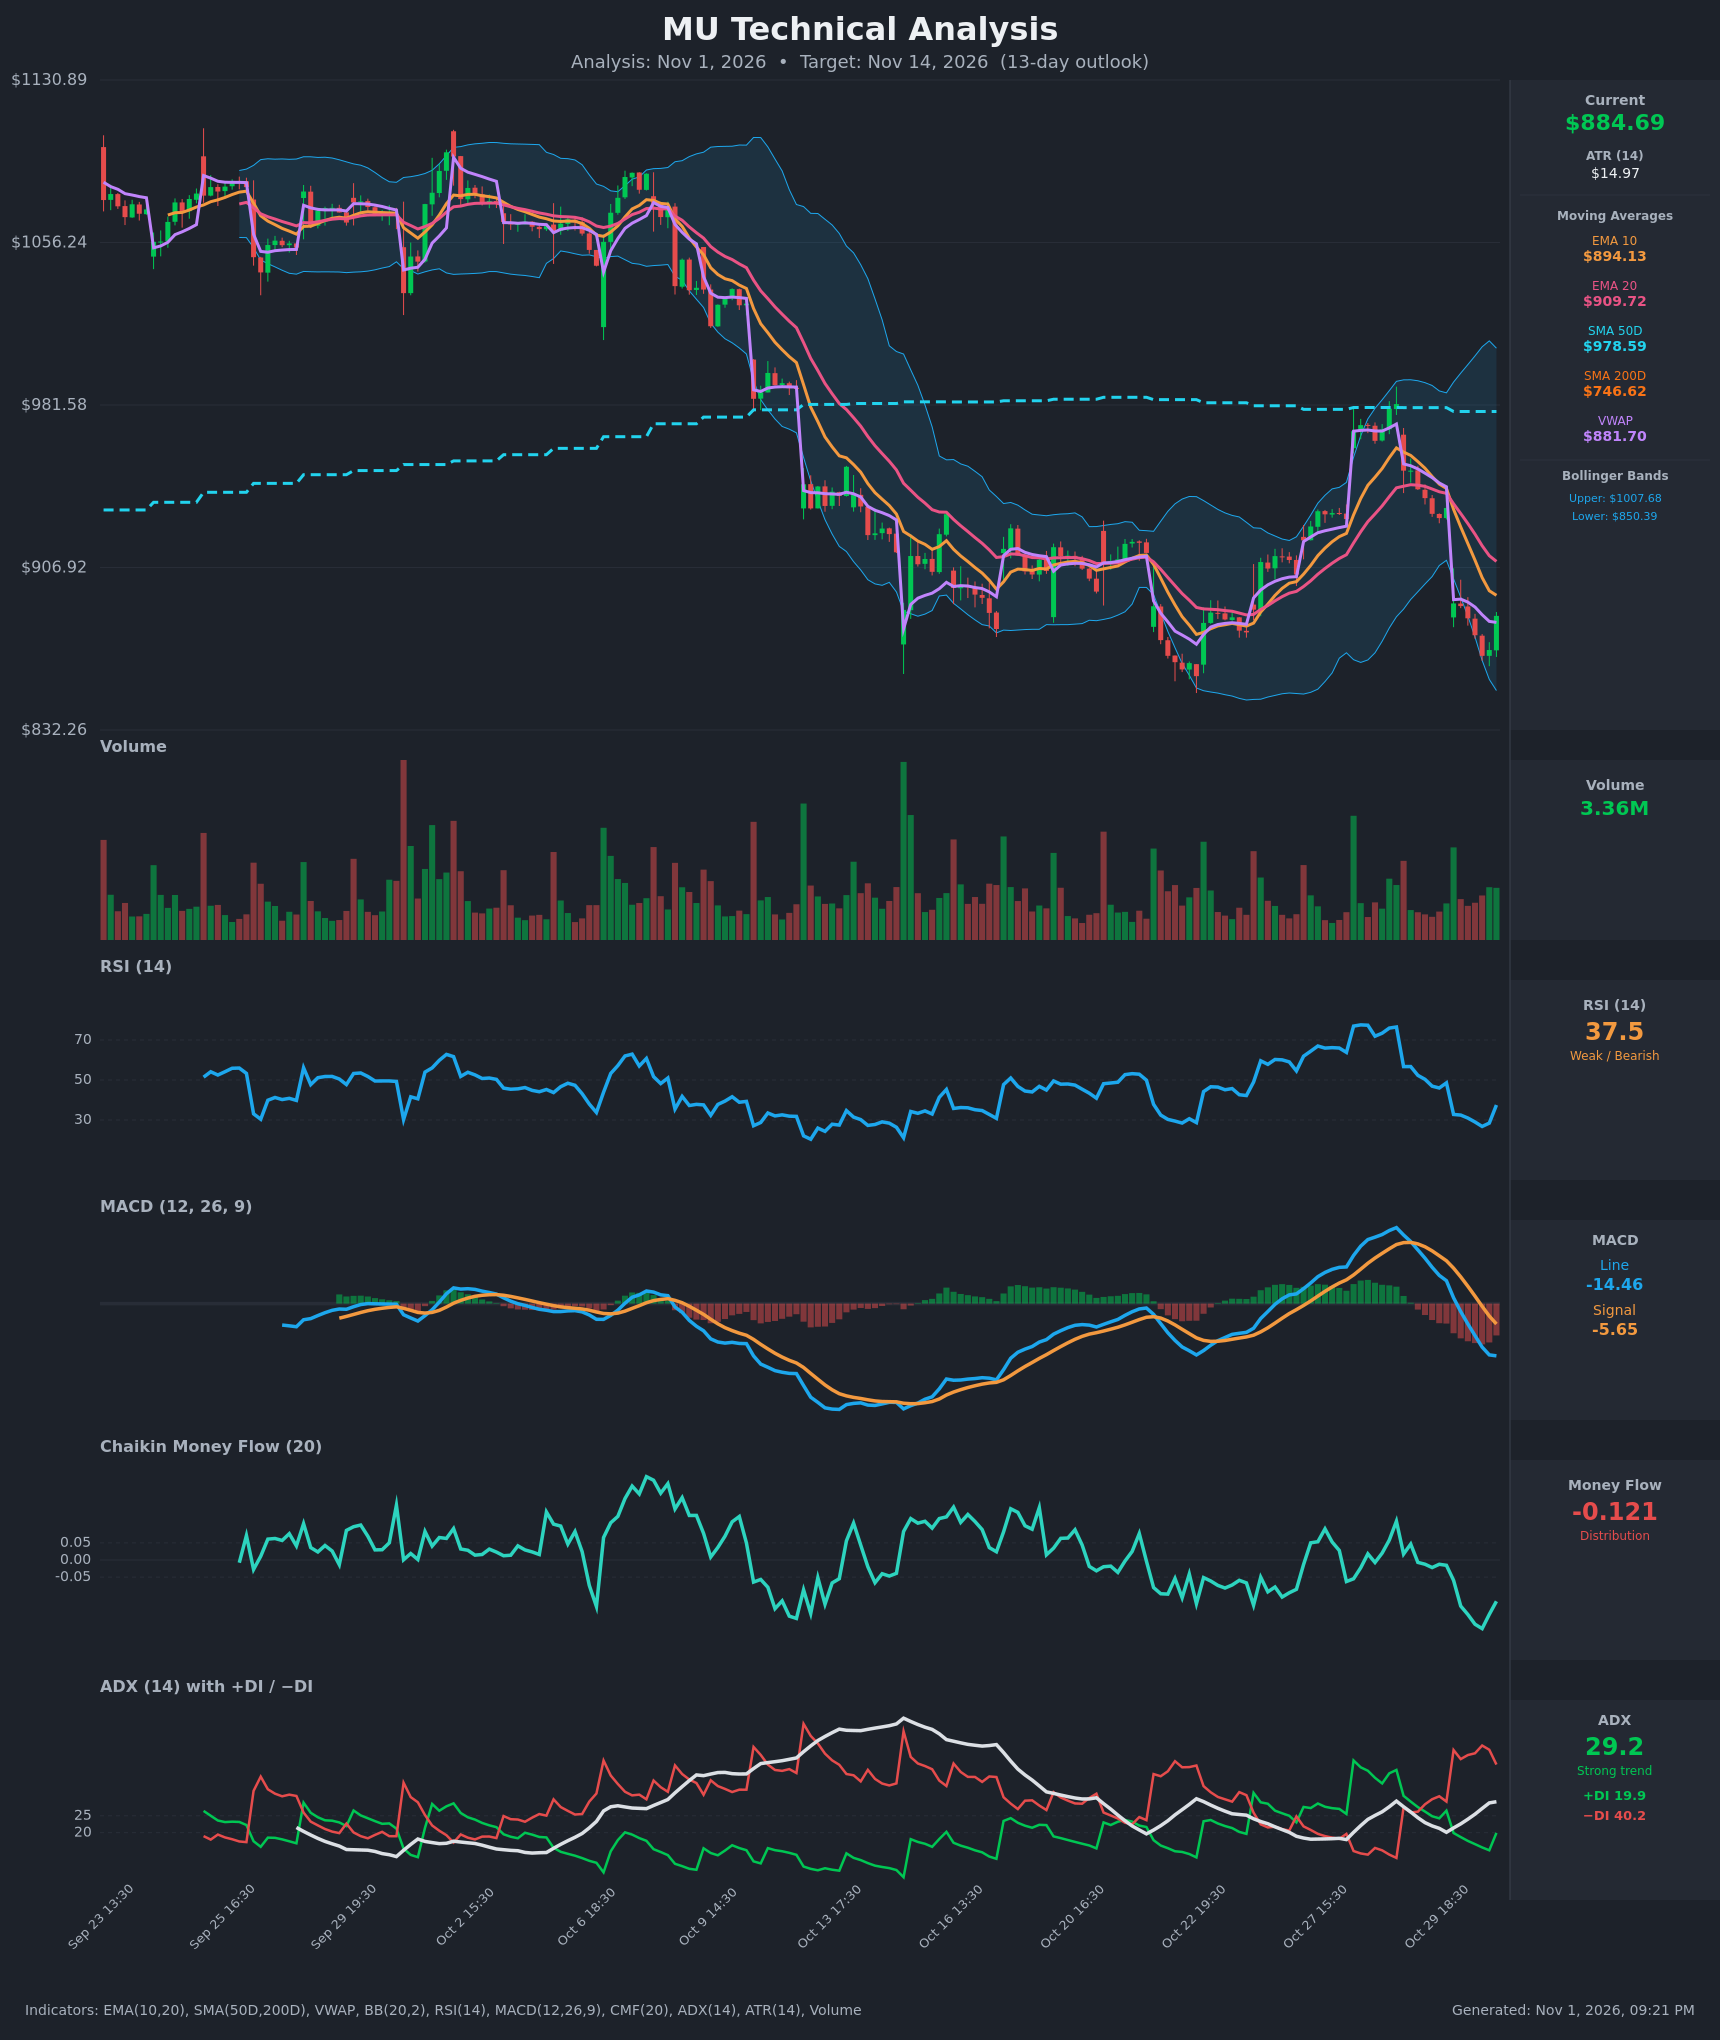
- RSI (14): 37.49, bouncing from 26.8 two bars ago, which was the oversold low. It has recovered but remains below 40 and under the 50 midline, so it reads as a relief bounce inside a downtrend. [Bearish]
- 20 EMA: $909.72, with the EMA10 at $894.13 below it (a bearish stack). Price at $884.69 is below both, so they act as overhead resistance. Price is also below the SMA50 ($978.59), though still above the SMA200 ($746.62). [Bearish]
- MACD: Line -14.46 is below signal -5.65, and the histogram is about -8.8. The bearish crossover happened on Oct 30 and the line is now below zero. The histogram shrank slightly from about -10.7 on the last bar, an early sign of decelerating downside momentum, but there is no bullish cross yet. [Bearish]
- Bollinger Bands (20): Upper $1007.68, lower $850.39, with the midline around $929. Price is in the lower third of the bands, near but not at the lower band. Bands are wide after the breakdown, which signals elevated volatility. A close back above the midline is unlikely in the short term. [Bearish]
- CMF (20): -0.121, well below -0.05. It has been negative since Oct 30 and bottomed near -0.20, ticking up slightly with the bounce. Selling pressure still dominates. [Distribution]
- ADX (14): 29.2 and rising, so the trend is strong. −DI (40.2) is far above +DI (19.9), so bears control. +DI is ticking up off its low, but the gap is still wide. [Strong Trend – Bearish]
- Volume: 3.36M on the latest green bounce bar, roughly average and with no capitulation spike. VWAP is $881.70 and price is just above it, so this is a minor intraday support test. The bounce lacks the conviction volume needed to signal a reversal. [Neutral/Weak Bounce]
DIVERGENCES & TRENDS
- There is no confirmed bullish divergence. RSI hit about 27 on Oct 30, close to its early-October lows around 25–28, while price is near the Oct 22 low zone. This is a mild exhaustion hint but not a signal.
- MACD histogram contraction on the last bar is the first deceleration sign, but the line is still falling away from the signal.
- Bearish events: MACD crossed down on Oct 30. A gap-down on Oct 30 took price from about $934 to $890. The EMA10 crossed below the EMA20 in the last few days. The Oct 27–28 rally to about $990 failed at the SMA50 and made a lower high.
- ADX has risen from 20 to 29 while −DI leads, which confirms the downtrend is strengthening.
- The SMA50 is rolling over but still above the SMA200, so there is no death cross yet.
CHART PATTERNS
- Bearish Rising Wedge / failed breakout (loose fit): The rally from the Oct 22 low to the Oct 28 spike near $990 failed at the SMA50 and reversed sharply, resembling a rising-wedge breakdown from the reference diagram. The measured implication is a retest of the prior low zone near $845–$850.
- Range breakdown: Price consolidated around $900–$930 from Oct 13–22. The Oct 30 gap down broke below the Oct 22 base, which is bearish continuation. The $909 EMA20 and the $930 zone are now resistance.
- There is no clean reversal pattern such as a double bottom yet. A lower low followed by a higher low would be needed.
POTENTIAL SCENARIOS
- Scenario 1: Bearish Trend Continuation — Price stays below the falling EMAs, rallies fail near $895–$910, and sellers push back to the lower band and the prior low zone. Trigger: break below $866 (Oct 30 low) on rising volume. Target: $850, with an extension to $832–$840. Invalidation: a daily close above $910 (EMA20). (50% probability)
- Scenario 2: Bullish Oversold Relief Rally — RSI turns up from oversold, MACD histogram keeps contracting, and price squeezes toward the EMA20 and the Bollinger midline. Trigger: close above $895 (EMA10) with CMF turning up. Target: $910–$930. Invalidation: loss of $866. (32% probability)
- Scenario 3: Neutral Base-Building — Price chops between the lower band and the EMAs while volatility compresses. Trigger: repeated holds of $850–$866 with rejection at $905. Target: $860–$895 range. Invalidation: a close outside $845–$912. (18% probability)
PRICE TARGETS
- Target Price: $865.00 (13-day)
- Expected Range: $826.00 to $908.00 (width $82 ≈ 9.3% of current price, consistent with the 8–12% guidance for 13 days)
- Key Levels: Support at $850.39, Resistance at $909.72
OVERALL BIAS
OVERALL BIAS: BEARISH - ADX of 29 with −DI at 40 vs +DI at 20, a MACD bearish cross below zero, negative CMF, and price below the EMAs and SMA50 all point to continuation lower. The oversold bounce (RSI 37) is likely a counter-trend rally that stalls near the $895–$910 EMA resistance.
This is educational analysis and not financial advice.