ASTS 20-day bearish forecast — Nov 1, 2026
- Bias: Bearish
- Timeframe: 20 days (made Nov 1, 2026, target date Nov 20, 2026)
- Price at analysis: $40.97
- Price target: $37.50
- Expected range: $32.00 – $45.00
- Result: Pending — graded after the close on Nov 20, 2026
Get a free AI analysis of ASTS today
Analysis
TECHNICAL INDICATORS
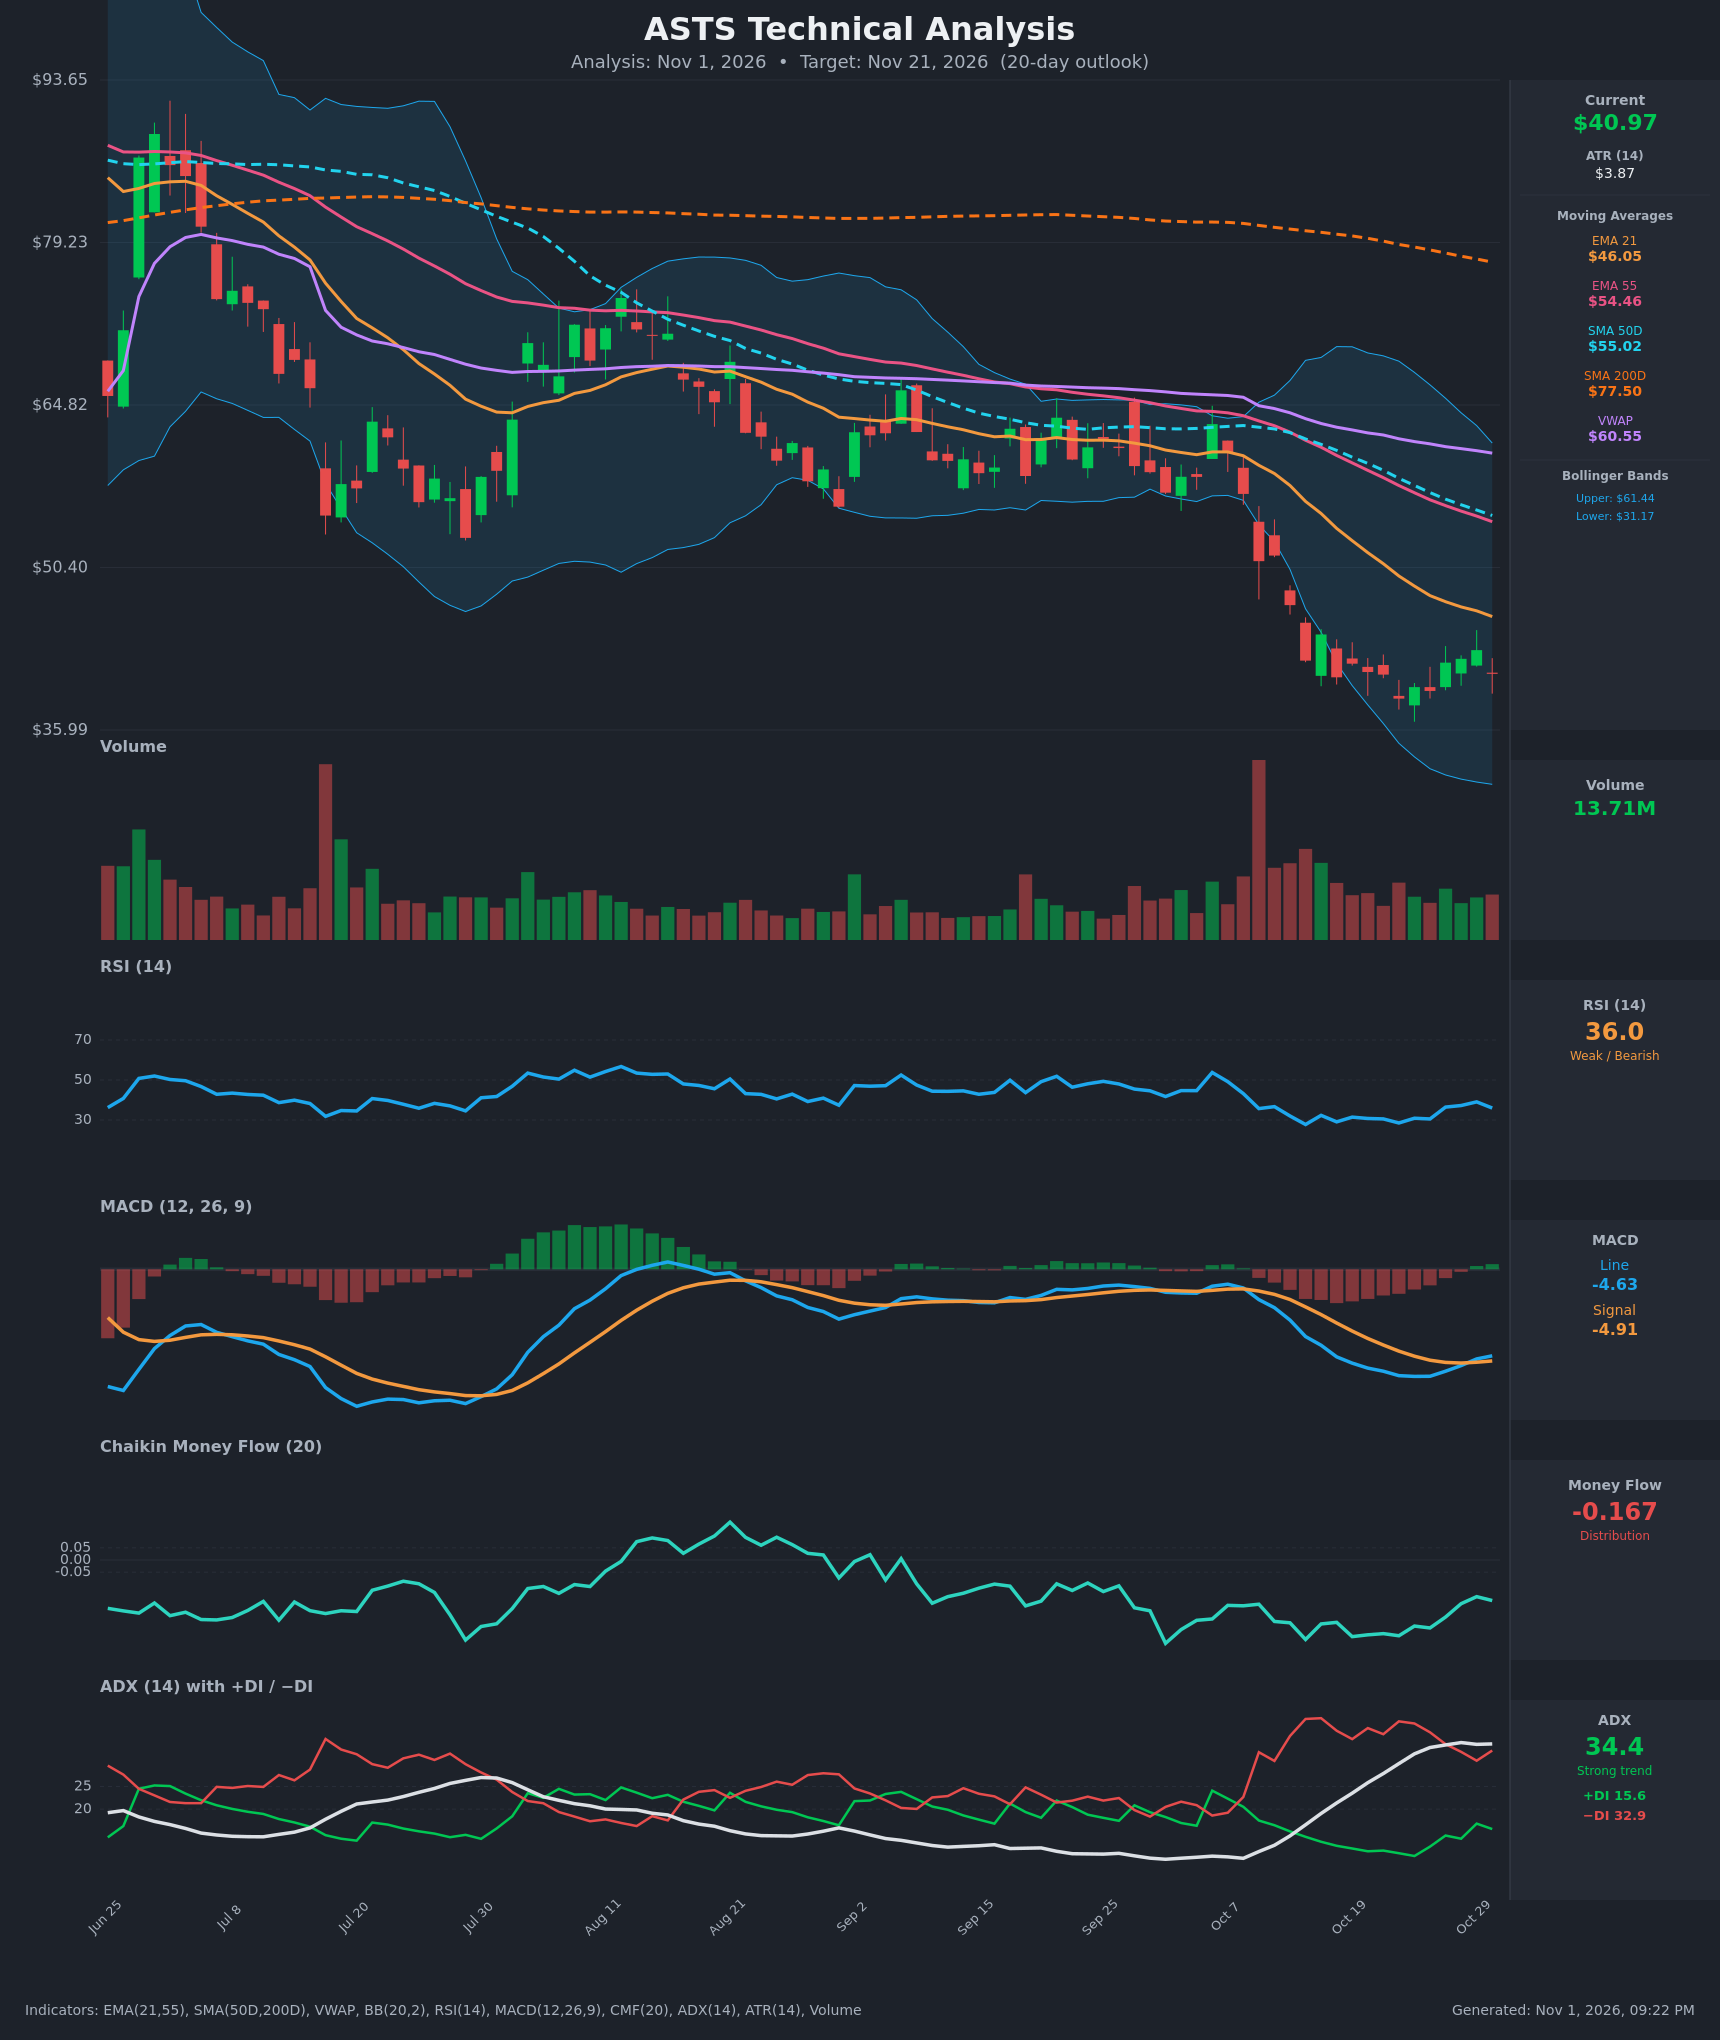
- RSI (14): 35.98, up from the 28.5 low on Oct 22 but still below 40 and below 50. The Oct 29 bounce to 39.1 failed, and the reading is turning back down. Momentum is weak and not yet oversold. [Bearish]
- 20 EMA: The EMA 21 is $46.05, about 12% above price, and falling steadily (from $58.74 on Oct 12). Price has been below it for the whole 15-bar window, and the EMA 55 ($54.46) and SMA 50D ($55.02) sit well above it as stacked overhead resistance. [Bearish]
- MACD: The line is -4.63 and the signal is -4.91, so the line is just above the signal after a mild bullish crossover on Oct 27. The histogram is slightly positive (+0.27), and the line has been rising since Oct 23. Both lines are deeply negative, so this is a weak relief bounce within a downtrend, not a trend reversal. [Neutral]
- Bollinger Bands (20): The upper band is $61.44, the lower band is $31.17 and the midline is about $46.3. Price at $40.97 is in the lower half of the bands, roughly one-third of the way up from the lower band. The bands are wide after the October breakdown, and price has walked the lower band without a sustained recovery above the midline. [Bearish]
- CMF (20): -0.167, well below -0.05. It improved from -0.327 (Oct 14) to -0.151 (Oct 29) and then slipped back, so selling pressure is easing but distribution persists. [Distribution]
- ADX (14): 34.4 and rising, with −DI at 32.9 above +DI at 15.6. This is a strong downtrend. ADX is flattening near 34-35 and −DI has declined from its 40 peak, which hints at some trend exhaustion. [Strong Trend – Bearish]
- Volume: 13.71M, average to below average on the recent bounce bars, after the heavy-volume capitulation on the Oct 7-8 gap down. The rebound is occurring on light volume, so there is no convincing buyer participation. [Bearish – weak bounce]
DIVERGENCES & TRENDS
- Moving average structure: Price is below the EMA 21, EMA 55, SMA 50D and SMA 200D ($77.50), and VWAP is at $60.55. The EMA 21 crossed below the EMA 55 earlier, and the SMA 50D is well under the SMA 200D (death cross already in place). The long-term trend is firmly down.
- Mild bullish divergence (momentum): Price made lower lows ($38.77 on Oct 22, $39.45 on Oct 26), but the MACD line and histogram are improving, and the CMF has risen from its lows. This suggests slowing downside momentum, not a reversal.
- RSI: It has not made a new low below 28.5 and is range-bound between 28 and 39. Failure at 39 and a turn back down to 36 shows sellers still defending rallies.
- Crossovers: The MACD bullish crossover on Oct 27 is a small positive, but it is occurring far below zero. −DI remains above +DI by a wide margin.
- Price action: A tight base is forming around $38-$44 after the steep drop from about $60, with lower highs on the bounce attempts (Oct 15 at $44.46 and Oct 29 at $43.07).
CHART PATTERNS
- Bearish Flag / Pennant (continuation): The sharp drop from about $60 to about $42 (Oct 7-14) was followed by sideways-to-slightly-rising consolidation between about $38.77 and $44.46. This fits the bearish flag/pennant from the reference. The measured move of the pole (about $18) projected from the breakdown level near $38.50 points to roughly $25-$30, though that is an extreme target for 20 days.
- Possible Bullish Falling Wedge / Double Bottom at $38.77-$39.45: The lows near $39 (Oct 22 and Oct 26) look like a minor double bottom. It needs a close above about $44.50, then the EMA 21 near $46, to be valid. Volume does not yet support it.
- Key break levels: A close below about $38.50 confirms the bearish continuation. A close above $46 would invalidate the bearish flag.
POTENTIAL SCENARIOS
- Scenario 1: Bearish Flag Breakdown Continuation — Price fails below the EMA 21 and the $43-$44 lower highs, then breaks the $38.77 double-bottom low. Strong ADX, −DI dominance and persistent distribution favor downside continuation. Trigger: Daily close below $38.50 on rising volume. Target: $33-$35, with an extension toward the lower Bollinger band area at about $31. Invalidation: Daily close above $46 (EMA 21). (50% probability)
- Scenario 2: Neutral Range-Bound Base — Price chops between $38.50 and $45 as downside momentum fades (MACD improving, CMF less negative) but there is no volume to push through the EMA 21. Trigger: Holding $38.50 while failing at $44-$46. Target: $39-$44. Invalidation: Close outside $37.50-$46.50. (22% probability)
- Scenario 3: Bullish Relief Rally — The double-bottom and MACD bullish divergence spark a mean-reversion bounce toward the EMA 21 and midline of the Bollinger Bands. Trigger: Close above $44.50 with volume above 20M. Target: $46-$50 (EMA 21 and Bollinger midline, then the gap area near $50). Invalidation: Close back below $39. (28% probability)
PRICE TARGETS
- Target Price: $37.50 (20-day, about 8.5% below current)
- Expected Range: $32.00 to $45.00 (width $13.00, about 31.7% of current price; this is wider than the 12-18% guideline for 30-60 days because the asset is volatile, with ATR at $3.87 or 9.4% of price, so a 20-day range of this width reflects realized volatility. A more conservative alternative would be $34.00 to $44.00.)
- Key Levels: Support at $38.50 (recent double-bottom lows; below that $34.00-$35.00 and $31.17 lower Bollinger band), Resistance at $46.05 (EMA 21; first resistance at $44.50, then $54.46 EMA 55)
OVERALL BIAS
OVERALL BIAS: BEARISH - Price is below all key moving averages with −DI far above +DI at ADX 34, CMF still in distribution and the bounce coming on weak volume, which points to a bearish flag. The MACD crossover and fading downside momentum limit conviction, but rallies into $44-$46 are more likely to be sold than to start a reversal.
This is educational analysis and not financial advice.