INTC 20-day bearish forecast — Nov 1, 2026
- Bias: Bearish
- Timeframe: 20 days (made Nov 1, 2026, target date Nov 20, 2026)
- Price at analysis: $65.76
- Price target: $63.50
- Expected range: $60.50 – $68.50
- Result: Pending — graded after the close on Nov 20, 2026
Get a free AI analysis of INTC today
Analysis
TECHNICAL INDICATORS
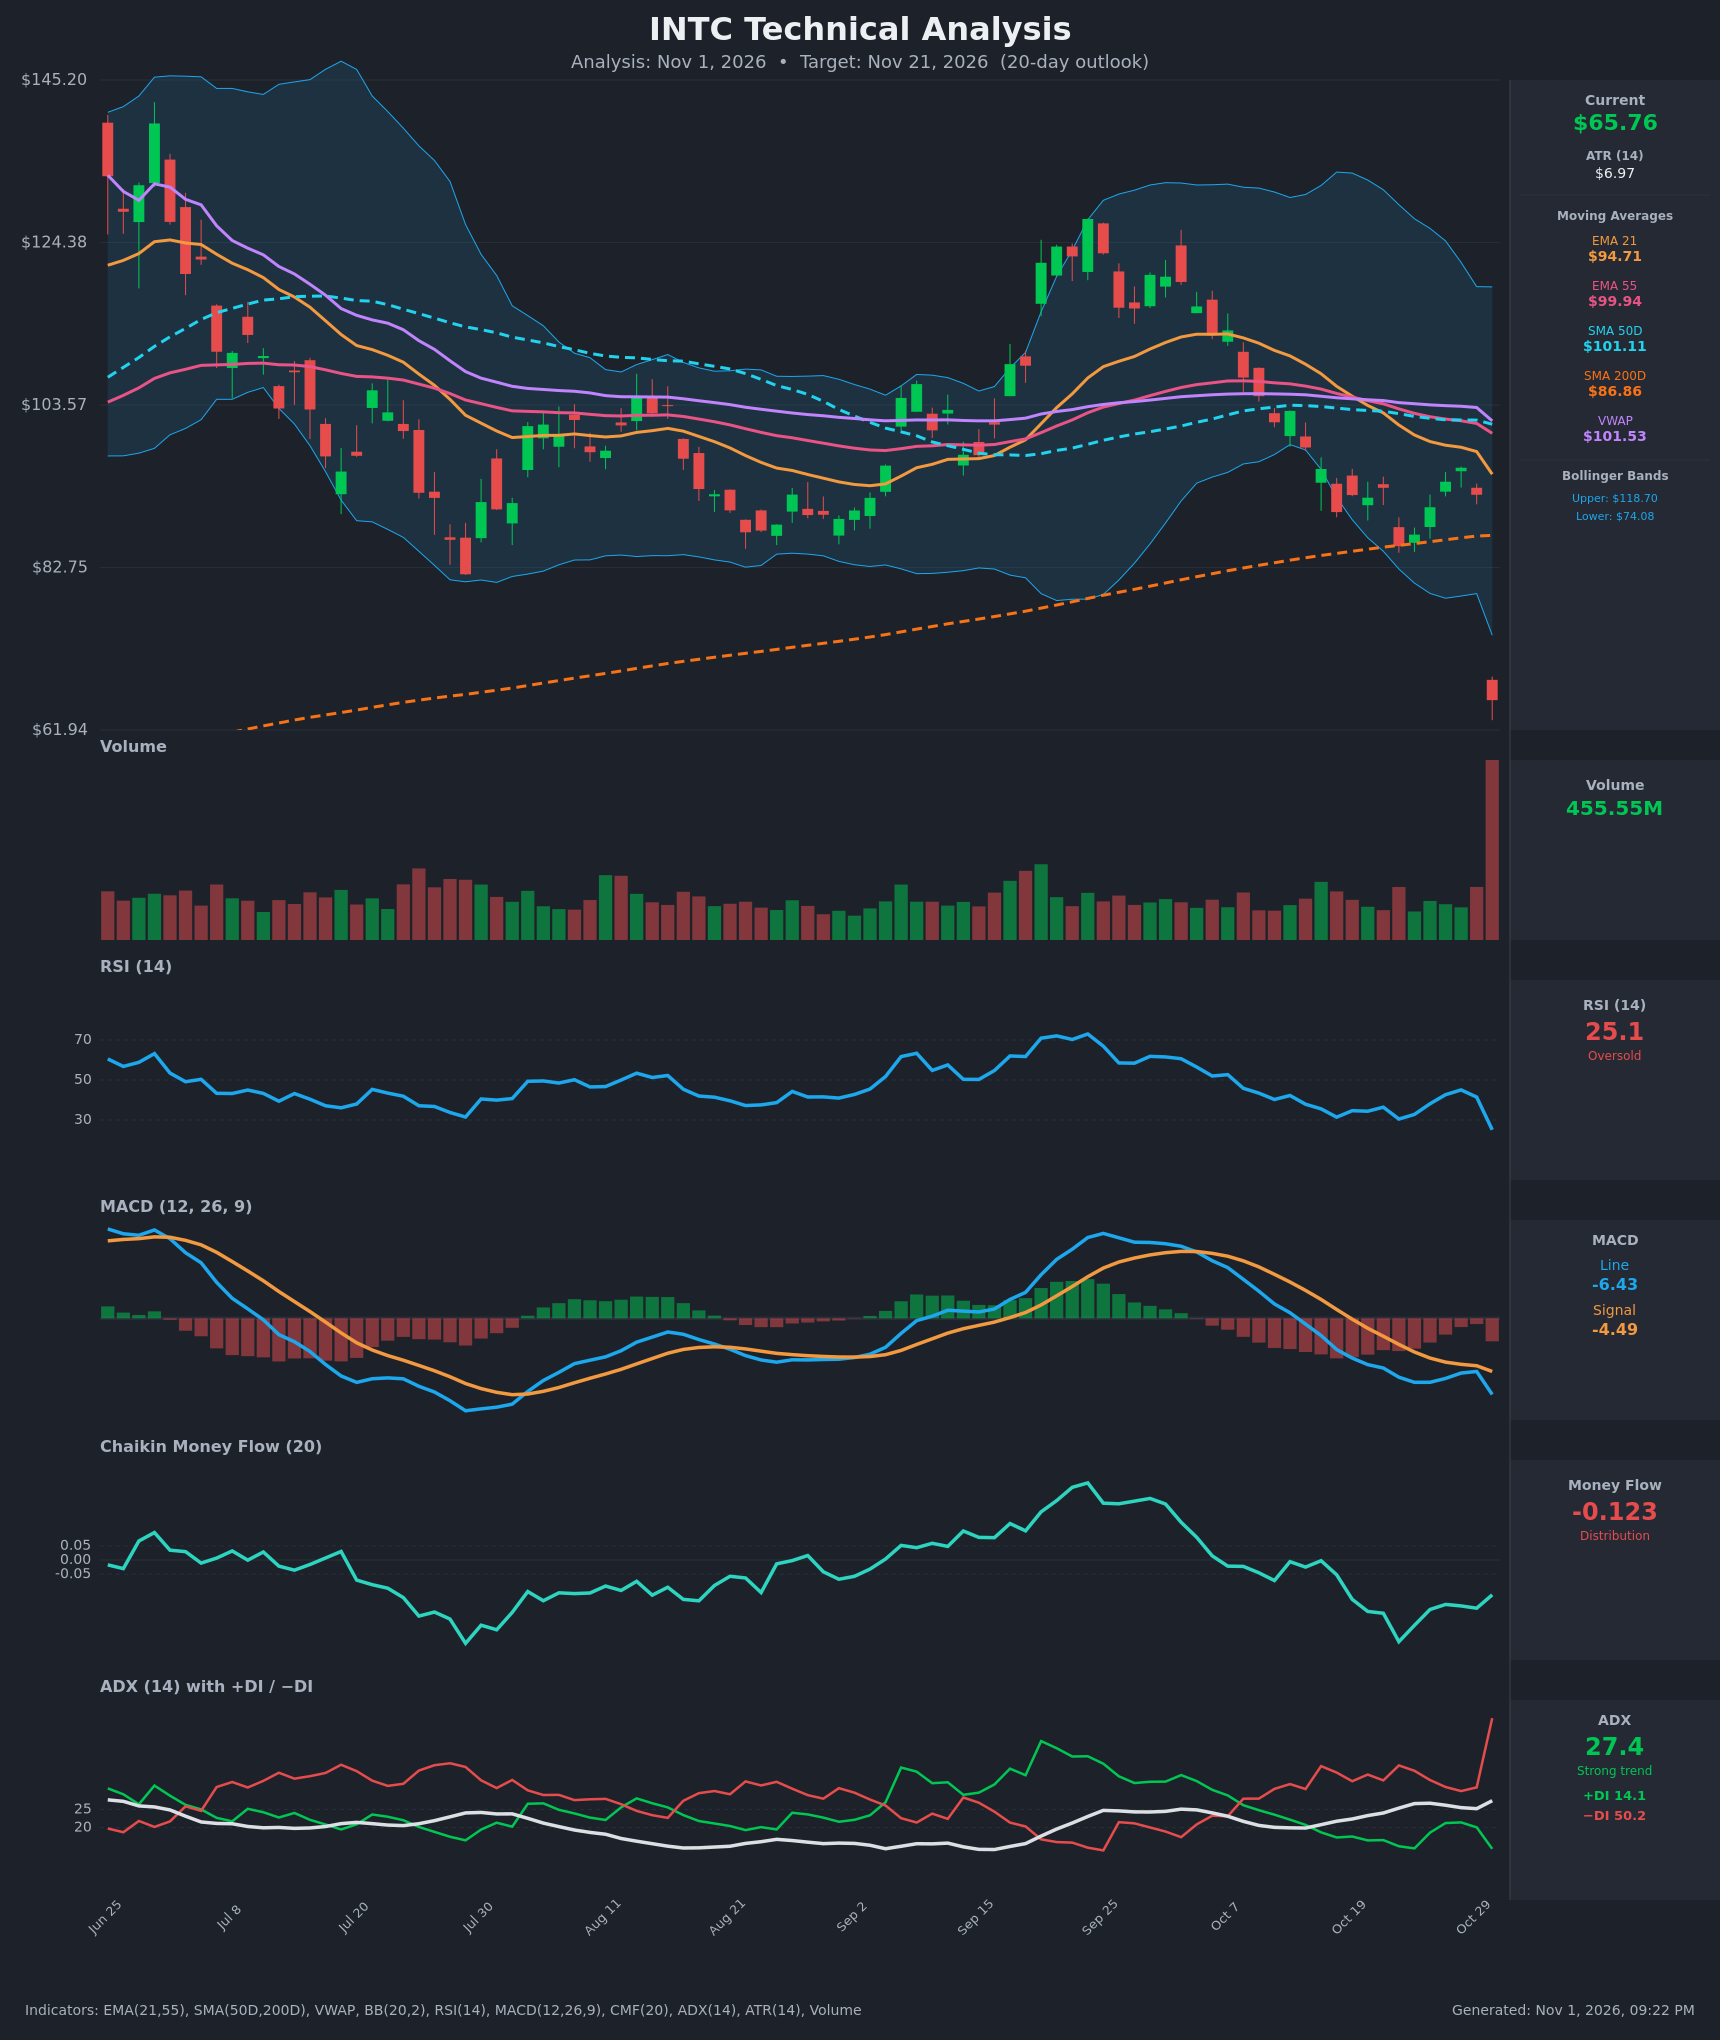
- RSI (14): 25.10, in oversold territory. It dropped from 41.5 to 25.1 in a single session, the lowest reading in the visible history. Momentum is sharply negative, but the extreme reading raises the odds of a relief bounce. [Bearish]
- 20 EMA: The EMA 21 is $94.71 and price at $65.76 sits about 31% below it. EMA 21 crossed below EMA 55 ($99.94) around Oct 20, and both are sloping down. The EMAs act as heavy overhead resistance. [Bearish]
- MACD: The line is -6.43 against a signal of -4.49, so the histogram is -1.94 and expanding. The bearish crossover occurred around Oct 19 and the gap widened on the latest bar. [Bearish]
- Bollinger Bands (20): Price is well below the lower band ($74.08), about $8.3 under it. The middle band is roughly $96.4 and the upper is $118.70. Closes this far outside the band show a capitulation-style move. They can mean a snap-back, but in strong downtrends price often "walks" the band. [Bearish]
- CMF (20): -0.123, below the -0.05 threshold. It has been negative for most of October, with a low of -0.288 on Oct 22, so selling pressure is persistent. [Distribution]
- ADX (14): 27.4 and rising (from 25.2). −DI is 50.2 and +DI is 14.1, a spread of 36 points. Bears are firmly in control and the downtrend is strong. [Strong Trend – Bearish]
- Volume: 455.55M, the largest bar on the chart by a wide margin. It came with a roughly 28.6% single-day gap-down candle ($92.07 → $65.76). That marks a decisive repricing event with possible climactic selling. Heavy volume on a breakdown validates the move, but it also raises the chance of a short-term exhaustion bounce. [Heavy distribution / breakdown confirmation]
DIVERGENCES & TRENDS
- There is no bullish RSI or MACD divergence. Both made new lows along with price, so momentum confirms the drop.
- The trend is bearish across the board. VWAP ($101.53), SMA50D ($101.11), EMA 55 and EMA 21 are all stacked above price.
- Price closed decisively below the SMA200D ($86.87), which had acted as support in late October (the Oct 22 low of $85.49 held near it). A close about 24% below it is a major trend break.
- SMA50D is still above SMA200D, so the golden cross technically remains. SMA50D is rolling over, though, and a death cross is plausible within weeks if price stays depressed.
- Price is far below every moving average, which leaves it stretched. The risk of a sharp relief rally is real, but moving averages are falling and would cap any bounce.
- ADX is rising with −DI spiking from 31 to 50, so trend strength is increasing, not fading.
- The CMF trend is bearish, with lower lows since the Sep peak above +0.15.
CHART PATTERNS
- Bearish Double Top (reference diagram): Price peaked near $127 in late September and again around $124 in early October. The neckline was around $85-90, near the Aug-Oct lows, and the Oct 22 low of about $85.49 tested it. The gap below that neckline completes the pattern. The measured move (about $40 height) points to the mid-$40s, which is beyond a 20-day horizon but shows the downside potential.
- The Oct 30 candle is a breakaway or exhaustion-style gap. Gaps this large are rarely filled quickly. The gap zone ($66-$92) now acts as resistance.
- The unfilled gap, the break below the SMA200D and the lower highs since late September all support continuation over reversal. A bounce would likely stall under $74-$80.
POTENTIAL SCENARIOS
- Scenario 1: Bearish Post-Gap Drift Continuation — Price carries the breakdown lower, with post-event selling pressure and a possible weak bounce rejected near the lower Bollinger Band. Trigger: failure to reclaim $70-$72 and a close below the gap-day low near $62. Target: $60.50-$64. Invalidation: daily close above $74.08 (lower BB). (50% probability)
- Scenario 2: Bullish Oversold Relief Bounce — RSI at 25 and a close 11% below the lower band invite a dead-cat bounce as short sellers cover. Trigger: a reversal day on declining volume, then a close above $70. Target: $72-$76, a partial retrace toward the lower BB and the gap-down zone. Invalidation: a fresh close below $62. (33% probability)
- Scenario 3: Neutral Base-Building Consolidation — Price stabilizes in a volatile range after the capitulation volume. Trigger: several inside days or small-range candles with MACD histogram flattening. Target: $63-$69 range. Invalidation: a close outside $61-$72. (17% probability)
PRICE TARGETS
- Target Price: $63.50 (20-day, Nov 21, 2026)
- Expected Range: $60.50 to $68.50 (width $8.00, about 12.2% of current price, consistent with the 14-21 day guidance)
- Key Levels: Support at $62.00 (gap-day low area), Resistance at $74.08 (lower Bollinger Band, first meaningful overhead level)
OVERALL BIAS
OVERALL BIAS: BEARISH - Price gapped about 29% lower on record volume, broke below the SMA200D and the double-top neckline, and sits under every moving average. MACD, CMF and −DI (50.2 vs 14.1) all confirm sellers in control. The oversold RSI of 25 means a bounce is likely along the way, but the modest-downside drift target of $63.50 reflects bearish evidence outweighing mean-reversion odds.
This is educational analysis and not financial advice.