META 20-day bearish forecast — Nov 1, 2026
- Bias: Bearish
- Timeframe: 20 days (made Nov 1, 2026, target date Nov 20, 2026)
- Price at analysis: $614.99
- Price target: $596.00
- Expected range: $566.00 – $628.00
- Result: Pending — graded after the close on Nov 20, 2026
Get a free AI analysis of META today
Analysis
TECHNICAL INDICATORS
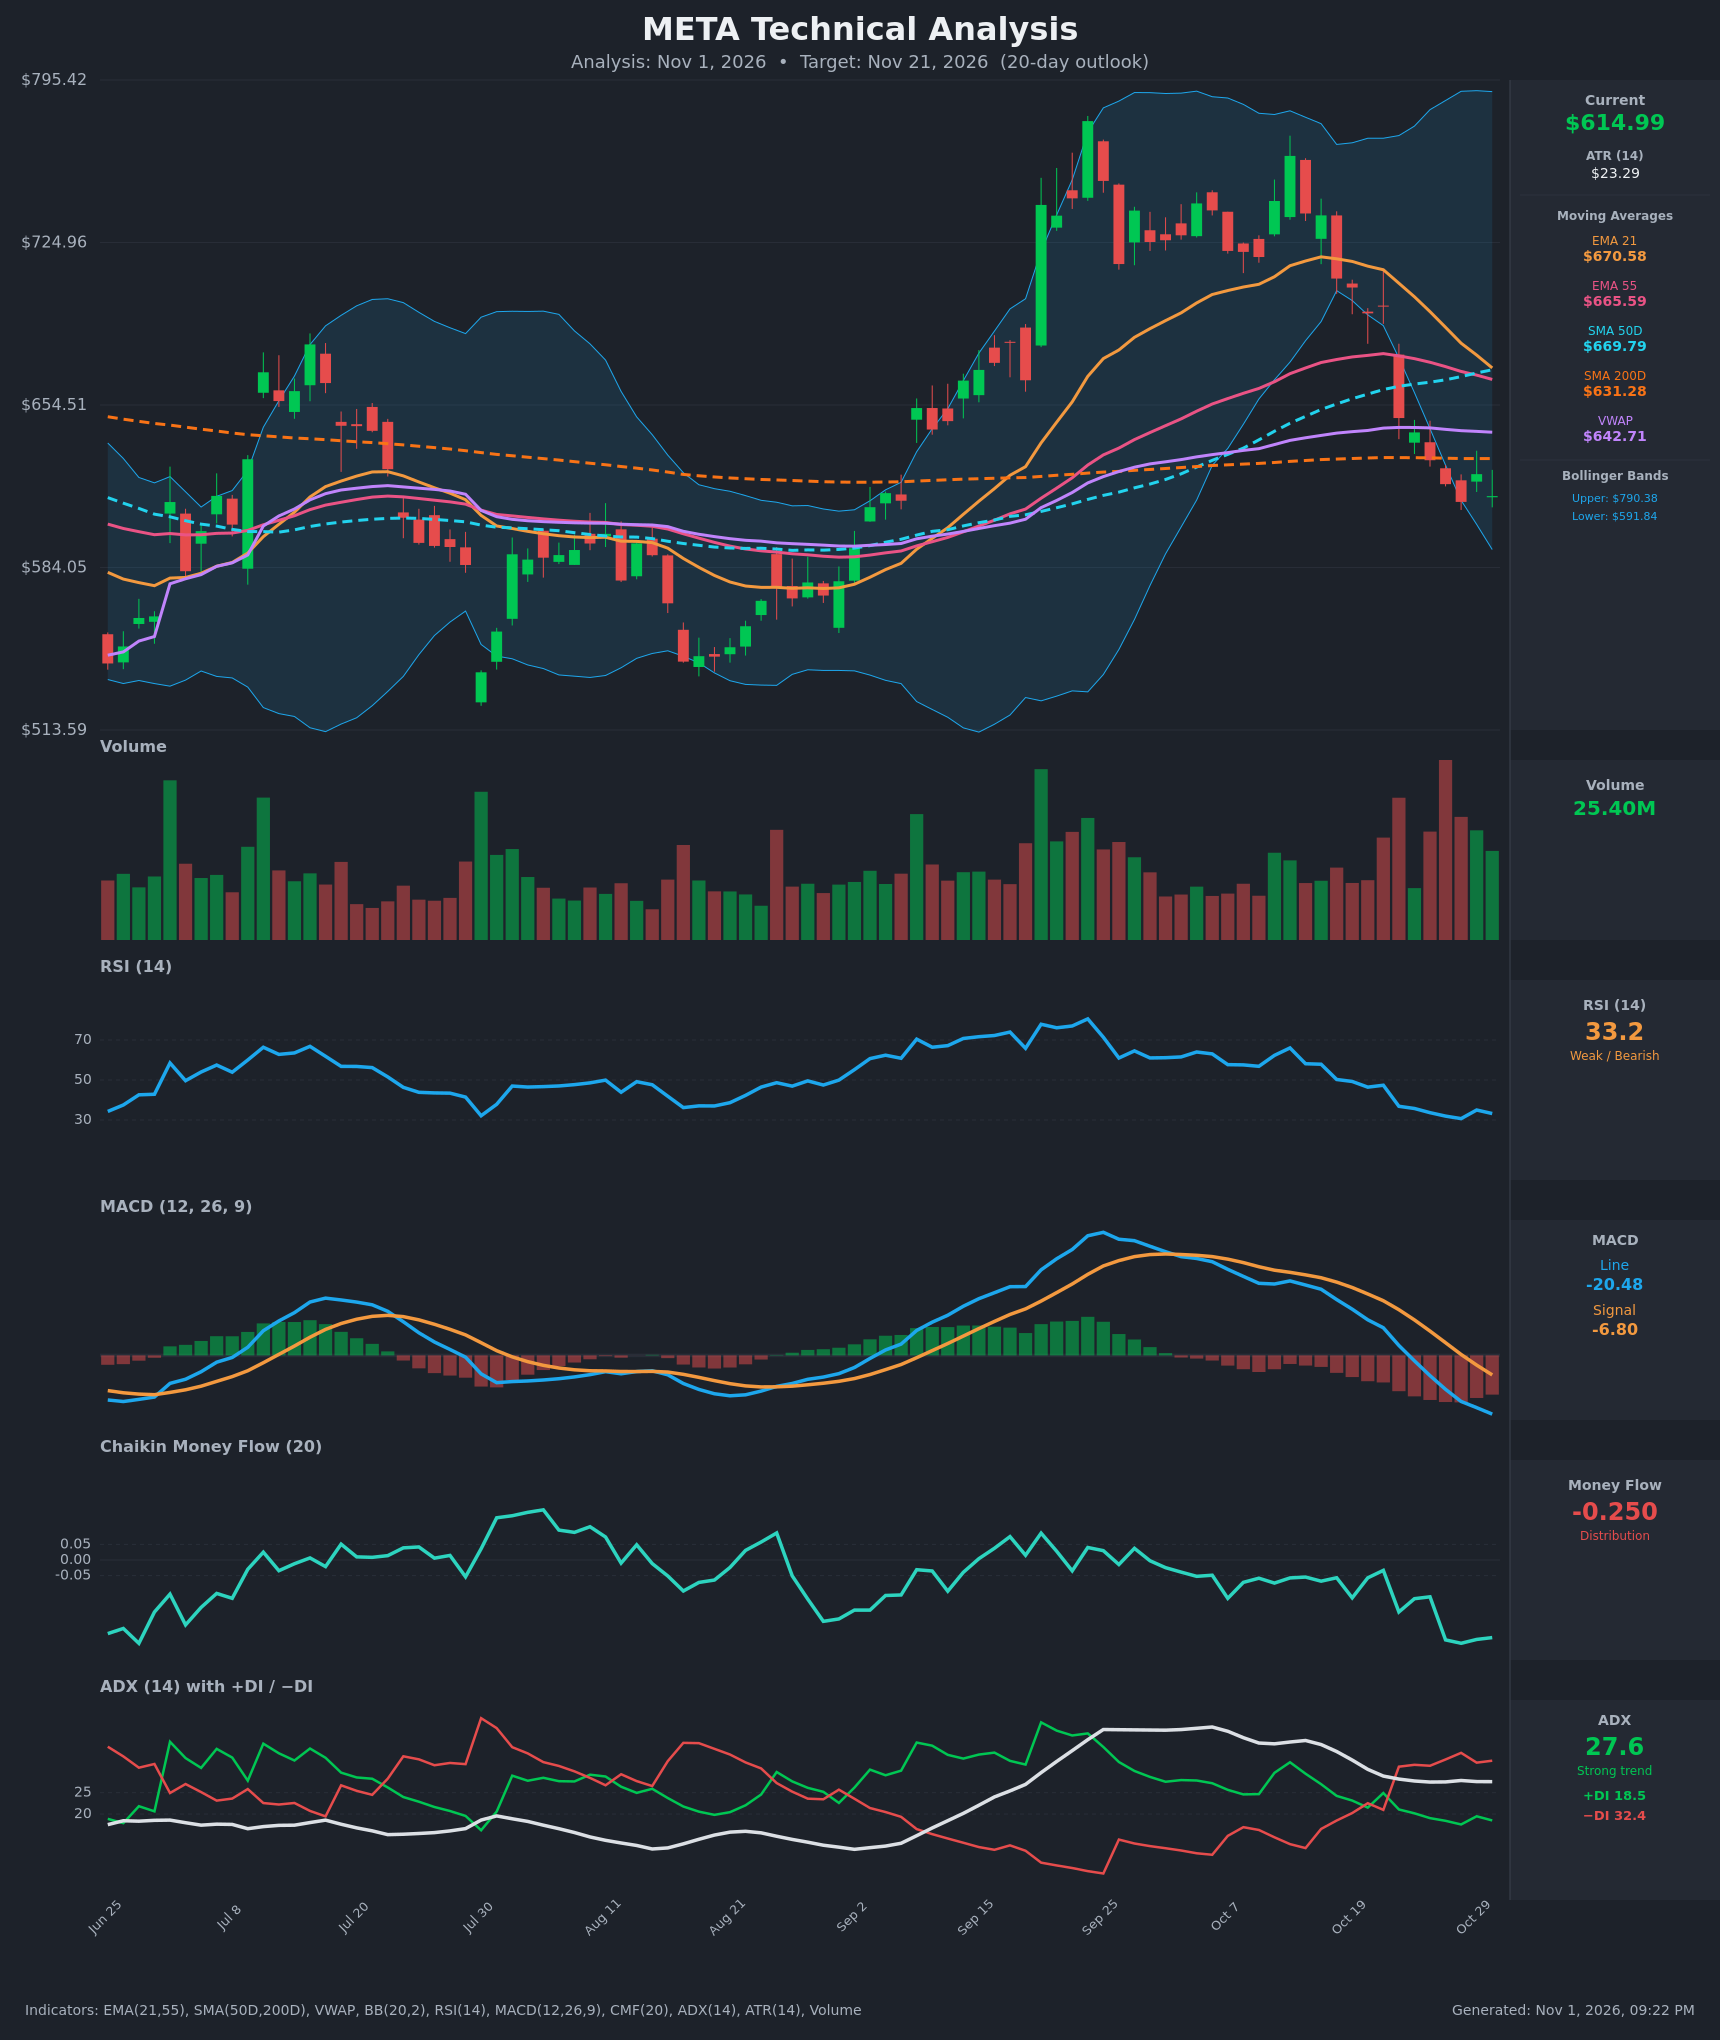
- RSI (14): 33.23, down from 66 on Oct 13 and just above the oversold line at 30. It dipped to 30.7 on Oct 28 and has only bounced weakly, so momentum is bearish but stretched. [Bearish]
- 20 EMA (EMA 21 on the data): $670.58, about 8.3% above price, and falling steeply (from $718.74 on Oct 15). It is acting as strong overhead resistance. EMA 21 is converging on EMA 55 ($665.59), and the gap has narrowed from about $48 to $5 in two weeks, so a bearish EMA cross is imminent. [Bearish]
- MACD: Line -20.48 is below Signal -6.80 and below zero. The histogram is about -13.7 and still expanding negative, so downside momentum is accelerating. The line crossed below the signal in early/mid Oct, and below zero on Oct 23. [Bearish]
- Bollinger Bands (20): Upper $790.38, lower $591.84, so the bands are still very wide after the September-October volatility. Price at $614.99 sits in the lower quarter of the bands, about $23 (roughly 1 ATR) above the lower band. The bands are starting to roll over. This is a bearish trend with limited room before a band-walk or bounce test. [Bearish]
- CMF (20): -0.250, far below the -0.05 threshold, and it has been sustained in negative territory since Oct 22. It is the weakest reading on the chart's recent history, which signals heavy distribution. [Distribution]
- ADX (14): 27.6, above 25 and stable. −DI (32.4) is well above +DI (18.5), and the DI cross to bearish happened on Oct 22. [Strong Trend – Bearish]
- Volume: 25.40M on the latest bar, with the highest bars of the recent window clustered on the red down days (Oct 22-27). The latest small green bar offers only a modest bounce attempt on comparable volume. Selling was heavy and conviction is on the sell side. [Bearish – distribution volume]
Other moving averages: price is below SMA 50 ($669.79), below VWAP ($642.71), and now below SMA 200 ($631.28), which is a breakdown of the long-term trend line. There is no death cross yet (SMA 50 is still above SMA 200 by about $38), but SMA 50 has flattened and is vulnerable.
DIVERGENCES & TRENDS
- No bullish divergence yet: RSI made a low of 30.7 on Oct 28 at a price of $612.49, and price has since basically retested ($614.99) with RSI at 33.2. This is a mild higher low in RSI, but MACD and CMF are making new lows, so there is no confirmed reversal.
- Bearish divergence at the top: Price made a high near $775 around Sep 25, then a lower high around $762 on Oct 13. RSI peaked near 77 in September and was only 66 in October. MACD peaked in late September and was much lower in October. This divergence preceded the current sell-off.
- Trend: Price has fallen about 19% from the Oct 13 high of $762.50. Lower highs and lower lows are intact. All short- and mid-term moving averages are rolling over.
- Crossovers and breaks: The DI bearish cross happened on Oct 22. The MACD zero-line break was on Oct 23. Price broke below SMA 50 and SMA 200. An EMA 21/55 bearish cross is imminent. The Oct 22 breakdown candle (-$48.7, a gap down through the EMAs and the 200 SMA) is the key event.
CHART PATTERNS
- Bearish Double Top (reversal): Peaks at roughly $775 (Sep 25) and $762 (Oct 13) with a neckline in the $690-$700 area. The neckline break on Oct 21-22 has already confirmed the pattern. The measured move (about $75 to $80 of height) points to roughly $615-$625, which has already been reached. That makes the next leg depend on a break of nearby support.
- Bearish Pennant/Flag (continuation) risk: The tight Oct 26-30 range at $612-$630 after a sharp leg down resembles a bearish pennant. A break below $612 would project another $60-$80 of downside, to roughly $550-$570. This is a secondary read, not a confirmed pattern.
- Support zone: The Aug-Sep base at $575-$600 is the next major demand area, and it lines up with the lower Bollinger Band at $591.84.
POTENTIAL SCENARIOS
- Scenario 1: Bearish Continuation Lower — Price fails at the SMA 200/VWAP zone, EMA 21 crosses under EMA 55, and distribution continues, pushing price to the lower Bollinger Band and the Aug-Sep demand zone. Trigger: Daily close below $612 (Oct 28 low). Target: $592, then $575-$580. Invalidation: Daily close above $645 on rising volume with CMF turning positive. (55% probability)
- Scenario 2: Bullish Oversold Relief Bounce — RSI near 30 and price close to the lower band prompt a mean-reversion rally toward the SMA 200 and VWAP, but it stalls below the declining EMAs. Trigger: Reclaim of $631 (SMA 200) on above-average volume. Target: $643 (VWAP), extended to $665-$670 (EMA 55/SMA 50 resistance). Invalidation: Rejection at $631-$643 and close back below $612. (30% probability)
- Scenario 3: Neutral Choppy Base — Price consolidates between $595 and $630 as selling exhausts but buyers lack conviction. Trigger: Inside days with declining volume and RSI holding 30-40. Target: $605-$620. Invalidation: Close outside the $590-$632 range. (15% probability)
PRICE TARGETS
Timeframe: 20 days (to about Nov 21, 2026).
- Target Price: $596.00
- Expected Range: $566.00 to $628.00 (width $62.00 = about 10.1% of current price, in line with the 14-21 day guidance of 8-12%)
- Key Levels: Support at $591.84 (lower Bollinger Band, near the Aug-Sep demand zone), Resistance at $631.28 (SMA 200, with VWAP at $642.71 just above)
OVERALL BIAS
OVERALL BIAS: BEARISH - Price is below all key moving averages, including the SMA 200. MACD is negative and widening, CMF is at -0.25 (heavy distribution), and ADX at 27.6 with −DI dominant confirms a strong downtrend. Oversold RSI argues for a possible bounce, but resistance at $631-$670 should cap it, favoring a drift toward $590-$600.
This is educational analysis and not financial advice.