MU 20-day bearish forecast — Nov 1, 2026
- Bias: Bearish
- Timeframe: 20 days (made Nov 1, 2026, target date Nov 20, 2026)
- Price at analysis: $884.74
- Price target: $850.00
- Expected range: $805.00 – $895.00
- Result: Pending — graded after the close on Nov 20, 2026
Get a free AI analysis of MU today
Analysis
TECHNICAL INDICATORS
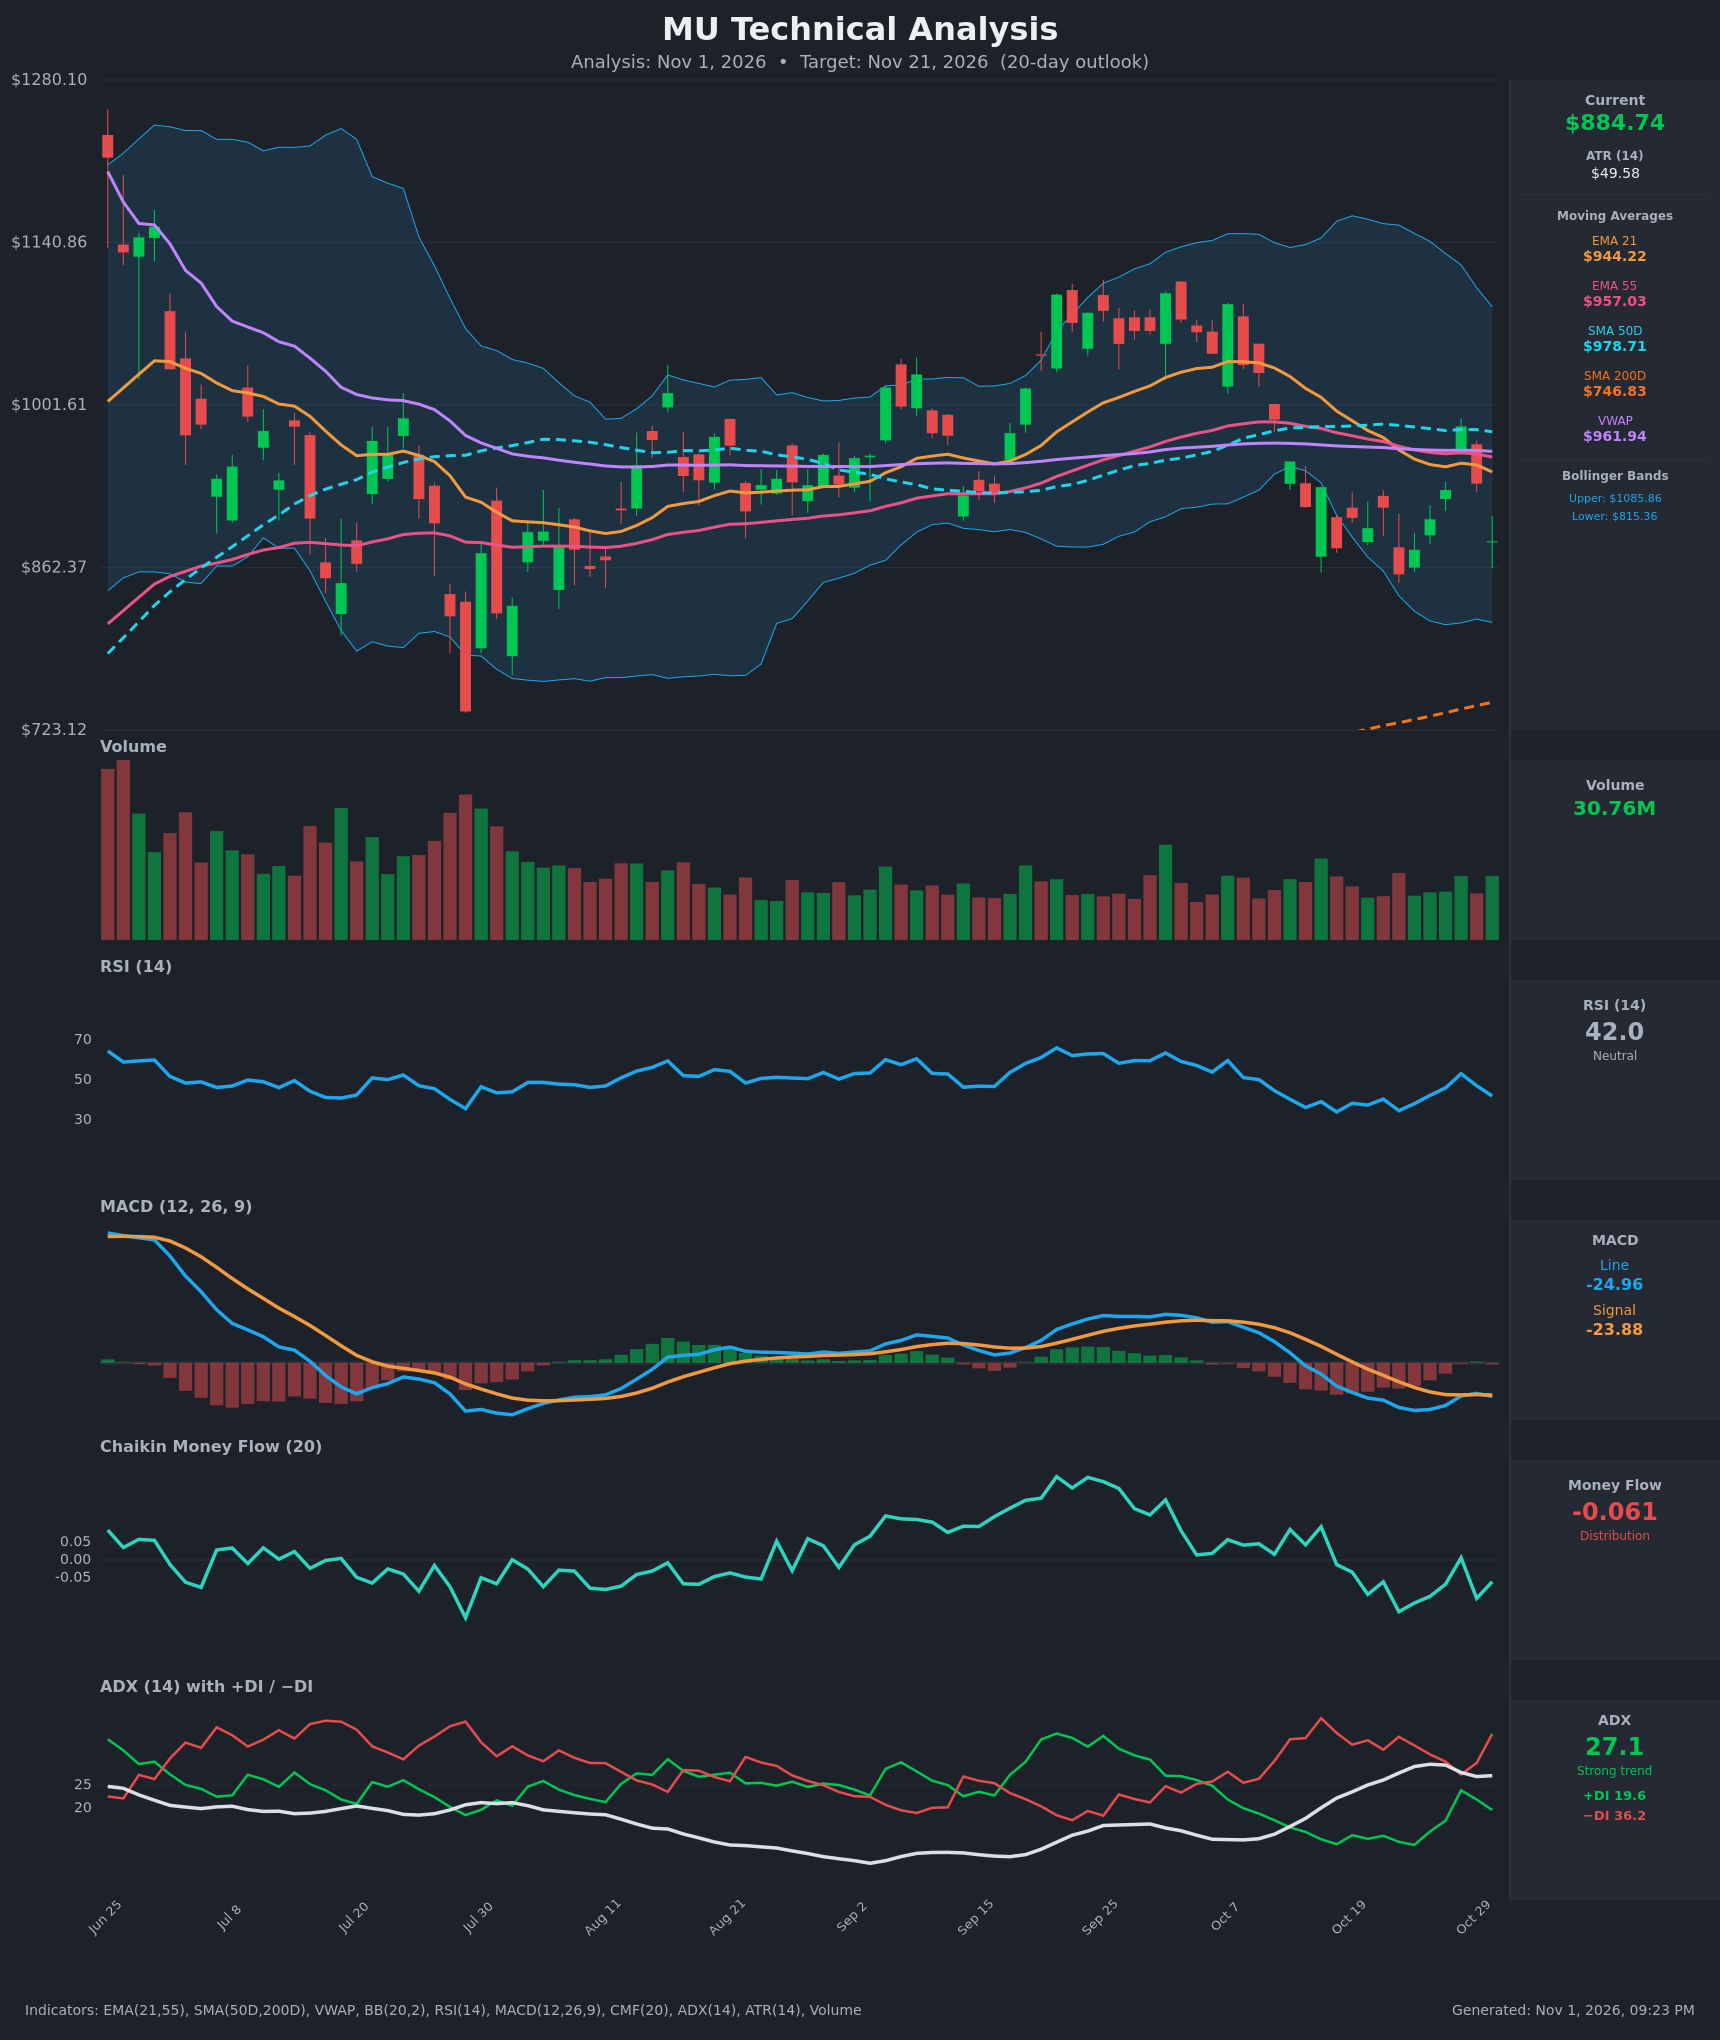
- RSI (14): 41.98, below the 50 midline and falling from 53.2 on Oct 28. It is not oversold (<30), so there is room to fall further. Recent lows (34.0, 34.7) held above 30, which shows buyers still step in on dips. [Bearish]
- 20 EMA (EMA 21): $944.22, with price at $884.74 about 6.3% below it. The EMA21 is also below the EMA55 ($957.03), a bearish cross that happened around Oct 22. Price was rejected near the EMA21/EMA55 zone on Oct 28 ($983 close) and has since rolled over. The EMAs are now overhead resistance. [Bearish]
- MACD: Line -24.96 is below Signal -23.88, so the histogram is slightly negative. The line briefly crossed above the signal on Oct 29 and re-crossed down on Oct 30, a failed bullish attempt. Both lines are below zero, and the line is turning down again after a shallow bounce. [Bearish]
- Bollinger Bands (20): Upper $1085.86, lower $815.36, midline about $950. Price is in the lower half, about 26% of the band width above the lower band. The bands are wide, so volatility is elevated. The October rejection from the upper band and the walk down toward the lower band favor sellers. [Bearish]
- CMF (20): -0.061, just below the -0.05 threshold and mostly negative since mid-October (low of -0.145). It bounced to about +0.006 on Oct 28 but failed to hold, so distribution is persistent but not extreme. [Distribution]
- ADX (14): 27.1, above 25, so the trend is strong. −DI (36.2) is far above +DI (19.6), which is bearish control. ADX has been rising since mid-October, so this is a developing downtrend. [Strong Trend – Bearish]
- Volume: 30.76M, roughly in line with recent averages. Selling days (Oct 22, Oct 30) show red candles with comparable or heavier volume, while bounces came on modest volume. There is no capitulation spike. [Mildly Bearish – no climactic washout]
DIVERGENCES & TRENDS
- No clear divergences. Price made a lower low on Oct 22 ($856.49) and RSI made a similar low (34.7 vs 34.0 on Oct 16), so momentum is confirming price.
- Trend structure: Price topped near $1,090 in late September and early October. Since then it has made lower highs ($983, then $983 again) and lower lows, a short-term downtrend.
- Moving averages:
- The EMA21/EMA55 bearish cross is already in place.
- SMA50D ($978.71) is above SMA200D ($746.83), so there is no death cross and the long-term trend is still up. The SMA50 is rolling over slightly.
- Price sits well above the SMA200 (about 18%), so a deeper pullback has room before long-term support.
- VWAP ($961.94) is overhead, and price is about 8% below it. This indicates sellers control the anchored average cost basis.
- MACD: Failed bullish crossover on Oct 29, re-crossed down on Oct 30. The weak bounce suggests sellers are defending rallies.
- DI: −DI re-expanded from 27.3 to 36.2 in two sessions after a brief narrowing, and ADX is rising, so bearish trend strength is building.
CHART PATTERNS
- Bearish Double Top / Triple Top (loose): The September–early October highs near $1,085–$1,100 formed several peaks. The break below the neckline zone near $960–$980 in mid-October is consistent with a topping structure. The measured move from a ~$1,090 top to a ~$960 neckline is about $130–$150, which implies roughly $820–$830, near the lower Bollinger Band ($815).
- Bearish Flag / Descending channel: The bounce from $856 to $983 (Oct 22–28) and its rejection resembles a corrective rally within a downtrend. A failure here points to continuation toward $815–$830.
- Counterpoint: The June–August base around $760–$870 shows the stock has found buyers on dips. If $856 and $815 hold, a range or double-bottom may form, which is the less likely bullish alternative.
POTENTIAL SCENARIOS
- Scenario 1: Bearish Continuation Toward Lower Bollinger Band — Sellers keep control (−DI dominant, ADX rising, price below all key MAs and VWAP). Price breaks the Oct 22 low and drifts toward the lower band. Trigger: daily close below $856.49 with MACD staying below signal. Target: $815–$830, with a 20-day target near $850. Invalidation: daily close above $944 (EMA21) with MACD crossing up. (52% probability)
- Scenario 2: Bullish Relief Bounce / Double-Bottom Base — Support near $856 and the lower band hold and RSI turns up from the low 40s. Price recovers into the EMA21/EMA55 cluster. Trigger: close above $930 on rising volume and CMF back above +0.05. Target: $944–$985 (EMA21, then SMA50/VWAP). Invalidation: close below $856. (30% probability)
- Scenario 3: Neutral Choppy Range — Price oscillates between $856 and $930 as ADX flattens. Trigger: failure to break either side for several sessions. Target: $870–$910. Invalidation: close outside $830–$945. (18% probability)
PRICE TARGETS
- Target Price: $850.00 (about -3.9%, 20-day horizon)
- Expected Range: $805.00 to $895.00. Width is $90, or about 10.2% of the current price, which fits the 14–21 day guidance of 8–12%.
- Key Levels: Support at $856.49 (Oct 22 closing low), with secondary support at $815.36 (lower Bollinger Band). Resistance at $944.22 (EMA21), with further resistance at $957–$979 (EMA55, VWAP, SMA50).
OVERALL BIAS
OVERALL BIAS: BEARISH - Price is below the EMA21, EMA55, SMA50 and VWAP. MACD is back below signal, CMF shows distribution, and −DI (36.2) dominates +DI (19.6) with ADX at 27 and rising. Modest conviction, because RSI is not oversold, the long-term SMA200 uptrend is intact, and a bounce toward $930–$945 is plausible.
This is educational analysis and not financial advice.