USO 20-day bullish forecast — Nov 1, 2026
- Bias: Bullish
- Timeframe: 20 days (made Nov 1, 2026, target date Nov 20, 2026)
- Price at analysis: $168.83
- Price target: $172.50
- Expected range: $156.00 – $183.00
- Result: Pending — graded after the close on Nov 20, 2026
Get a free AI analysis of USO today
Analysis
TECHNICAL INDICATORS
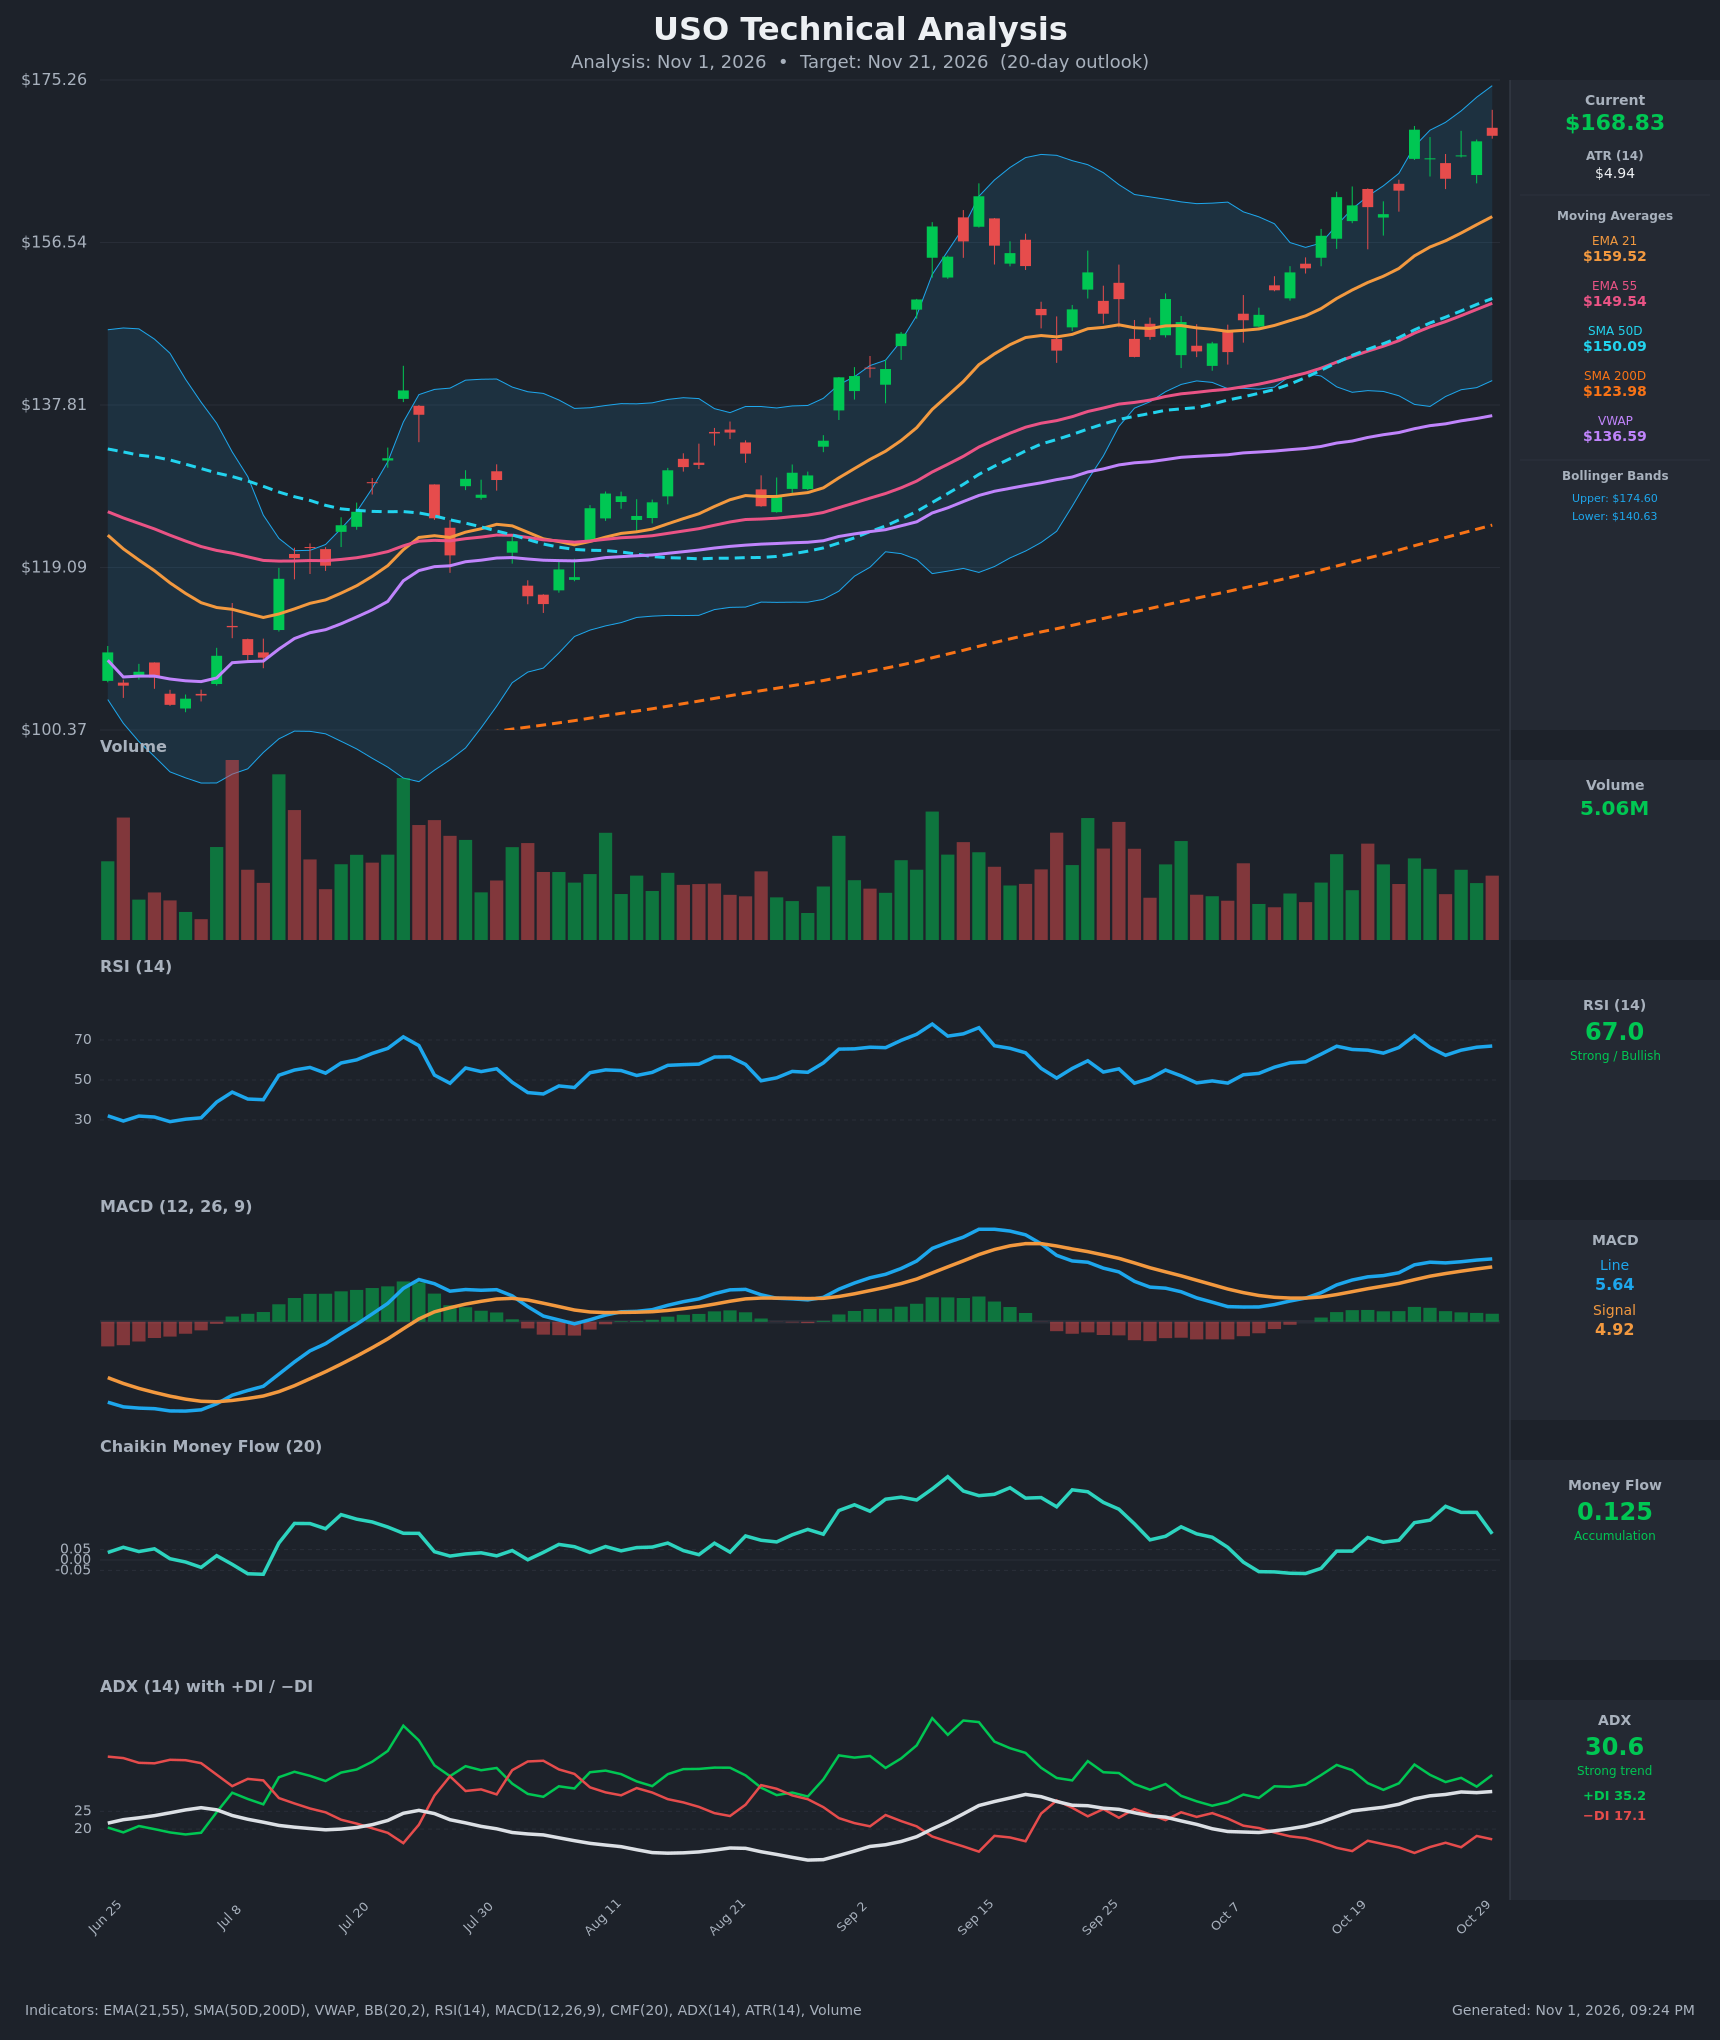
- RSI (14): 66.98, just below the 70 overbought line. It is holding in the 62-72 zone for the past two weeks, with a higher low near 62.4 on Oct 27. Momentum is strong but not yet stretched. [Bullish]
- 20 EMA: The data supplies EMA 21 at $159.52, with price about 5.8% above it. The EMA is rising steadily (146.98 → 159.52 in 15 bars) and has acted as dynamic support through the uptrend. EMA21 is also well above EMA55 ($149.54), so the bullish alignment is intact. Price is somewhat extended from it, so a pullback toward it is possible. [Bullish]
- MACD: Line 5.639 is above signal 4.918, a positive spread of about 0.72 that has widened for 15 bars. The line made a new high for the move, and the histogram is positive and slowly expanding. The bullish crossover happened around Oct 14, and momentum is confirmed. [Bullish]
- Bollinger Bands (20): Price at $168.83 sits in the upper third of the bands (upper $174.60, lower $140.63, mid about $157.6). The bands are expanding, and price is walking the upper half after touching the upper band on Oct 23. Band-walking is typical of a strong trend, but it is also near the band ceiling. [Bullish]
- CMF (20): 0.125, which is accumulation (>0.05). It is positive for 10 straight bars but dipped from 0.227 to 0.125 on the last bar, so buying pressure is easing slightly. [Accumulation]
- ADX (14): 30.6 and rising (19.5 → 30.6), with +DI 35.2 well above -DI 17.1. This is a strong, maturing uptrend with bulls clearly in control. [Strong Trend – Bullish]
- Volume: 5.06M on the latest bar, a muted reading versus the spikes in the Sep rally. Recent up days show decent volume, but the final candle is a red, rejection-style bar. Participation is adequate but not expanding on the push to new highs. [Neutral to mildly cautious]
DIVERGENCES & TRENDS
- No bearish RSI divergence yet: RSI (67) is below its Oct 23 peak (72.2) while price is just below its Oct 23 high ($169.53). The latest close of $168.83 is a mild lower high in both, so there is no clear divergence. The September RSI peak near 77 was higher than today's, which shows the current rally is less overbought than the earlier one.
- MACD is making new highs alongside price, which confirms the trend.
- CMF has pulled back from 0.256 to 0.125 while price is near highs. This is a minor warning and not a divergence.
- Moving-average structure: Price ($168.83) > EMA21 ($159.52) > EMA55 ($149.54) ≈ SMA50 ($150.09) > VWAP ($136.59) > SMA200 ($123.98). EMA21 crossed above EMA55 well before this window. SMA50 has recently crossed above EMA55, and SMA200 is rising, so the long-term trend is clearly up. The golden cross (SMA50 over SMA200) is already in place, with a wide gap.
- ADX is rising above 25 with +DI > -DI, which confirms trend strength. Price is far above VWAP and SMA200, so it is stretched on a longer-term basis, and mean-reversion risk builds if momentum fades.
CHART PATTERNS
- Ascending staircase / higher highs and higher lows channel: This is the dominant structure since the mid-Aug base. It is a trend continuation, similar to the diagram's Bullish Flag pattern.
- Mid-Oct consolidation: Price consolidated between about $150 and $162 before breaking out above $162 on Oct 23. This is a flag/pennant-style continuation with a breakout. A measured move of roughly $12 from the $157 mid-point of the consolidation points to about $175-$180.
- Possible short-term risk: Price is pressing into the upper Bollinger Band near $174.60, and the last candle is red with an upper wick. This hints at short-term resistance and a possible shallow pullback or digestion, but no reversal pattern (double top, H&S) is confirmed.
- Targets: Continuation measured move $175-$180. Pullback support at the $159-$160 EMA21 area.
POTENTIAL SCENARIOS
- Scenario 1: Bullish Trend Continuation — The strong ADX, rising MAs and positive CMF support a grind higher after a brief digestion near $165. Trigger: close above $169.53-$170 (the Oct 23 high) and a break of the upper BB at about $174.60. Target: $176-$180. Invalidation: close below $159.50 (EMA21). (50% probability)
- Scenario 2: Neutral Consolidation Then Resumption — Price stalls beneath $175 and oscillates in a $160-$173 range as RSI cools from near 70. Trigger: failure to hold above $170 with falling volume, but support at the EMA21 holds. Target: $163-$170. Invalidation: close above $175 or below $158. (30% probability)
- Scenario 3: Bearish Mean-Reversion Pullback — An overextended price (about 35% above SMA200, 23% above VWAP) and fading CMF trigger profit-taking back toward the 50-day cluster. Trigger: daily close below $159.50 with MACD histogram turning negative. Target: $150-$152 (SMA50/EMA55). Invalidation: reclaim of $166. (20% probability)
PRICE TARGETS
- Target Price: $172.50 (20-day horizon)
- Expected Range: $156.00 to $183.00 (width $27.00 ≈ 16.0% of the current price, consistent with the 14-21 day to 30-60 day guidance for a 20-day horizon)
- Key Levels: Support at $159.50 (EMA21 / mid-consolidation), Resistance at $174.60 (upper Bollinger Band; secondary at $180)
OVERALL BIAS
OVERALL BIAS: BULLISH - ADX at 30.6 with +DI roughly double -DI, a rising MACD above its signal, and positive CMF all point to a strong uptrend. Price is above every key moving average, so the path of least resistance is higher, though price is extended and near the upper Bollinger Band, which makes a brief pullback likely along the way.
This is educational analysis and not financial advice.