ASTS 27-day bearish forecast — Nov 1, 2026
- Bias: Bearish
- Timeframe: 27 days (made Nov 1, 2026, target date Nov 27, 2026)
- Price at analysis: $40.97
- Price target: $37.50
- Expected range: $33.00 – $46.00
- Result: Pending — graded after the close on Nov 27, 2026
Get a free AI analysis of ASTS today
Analysis
TECHNICAL INDICATORS
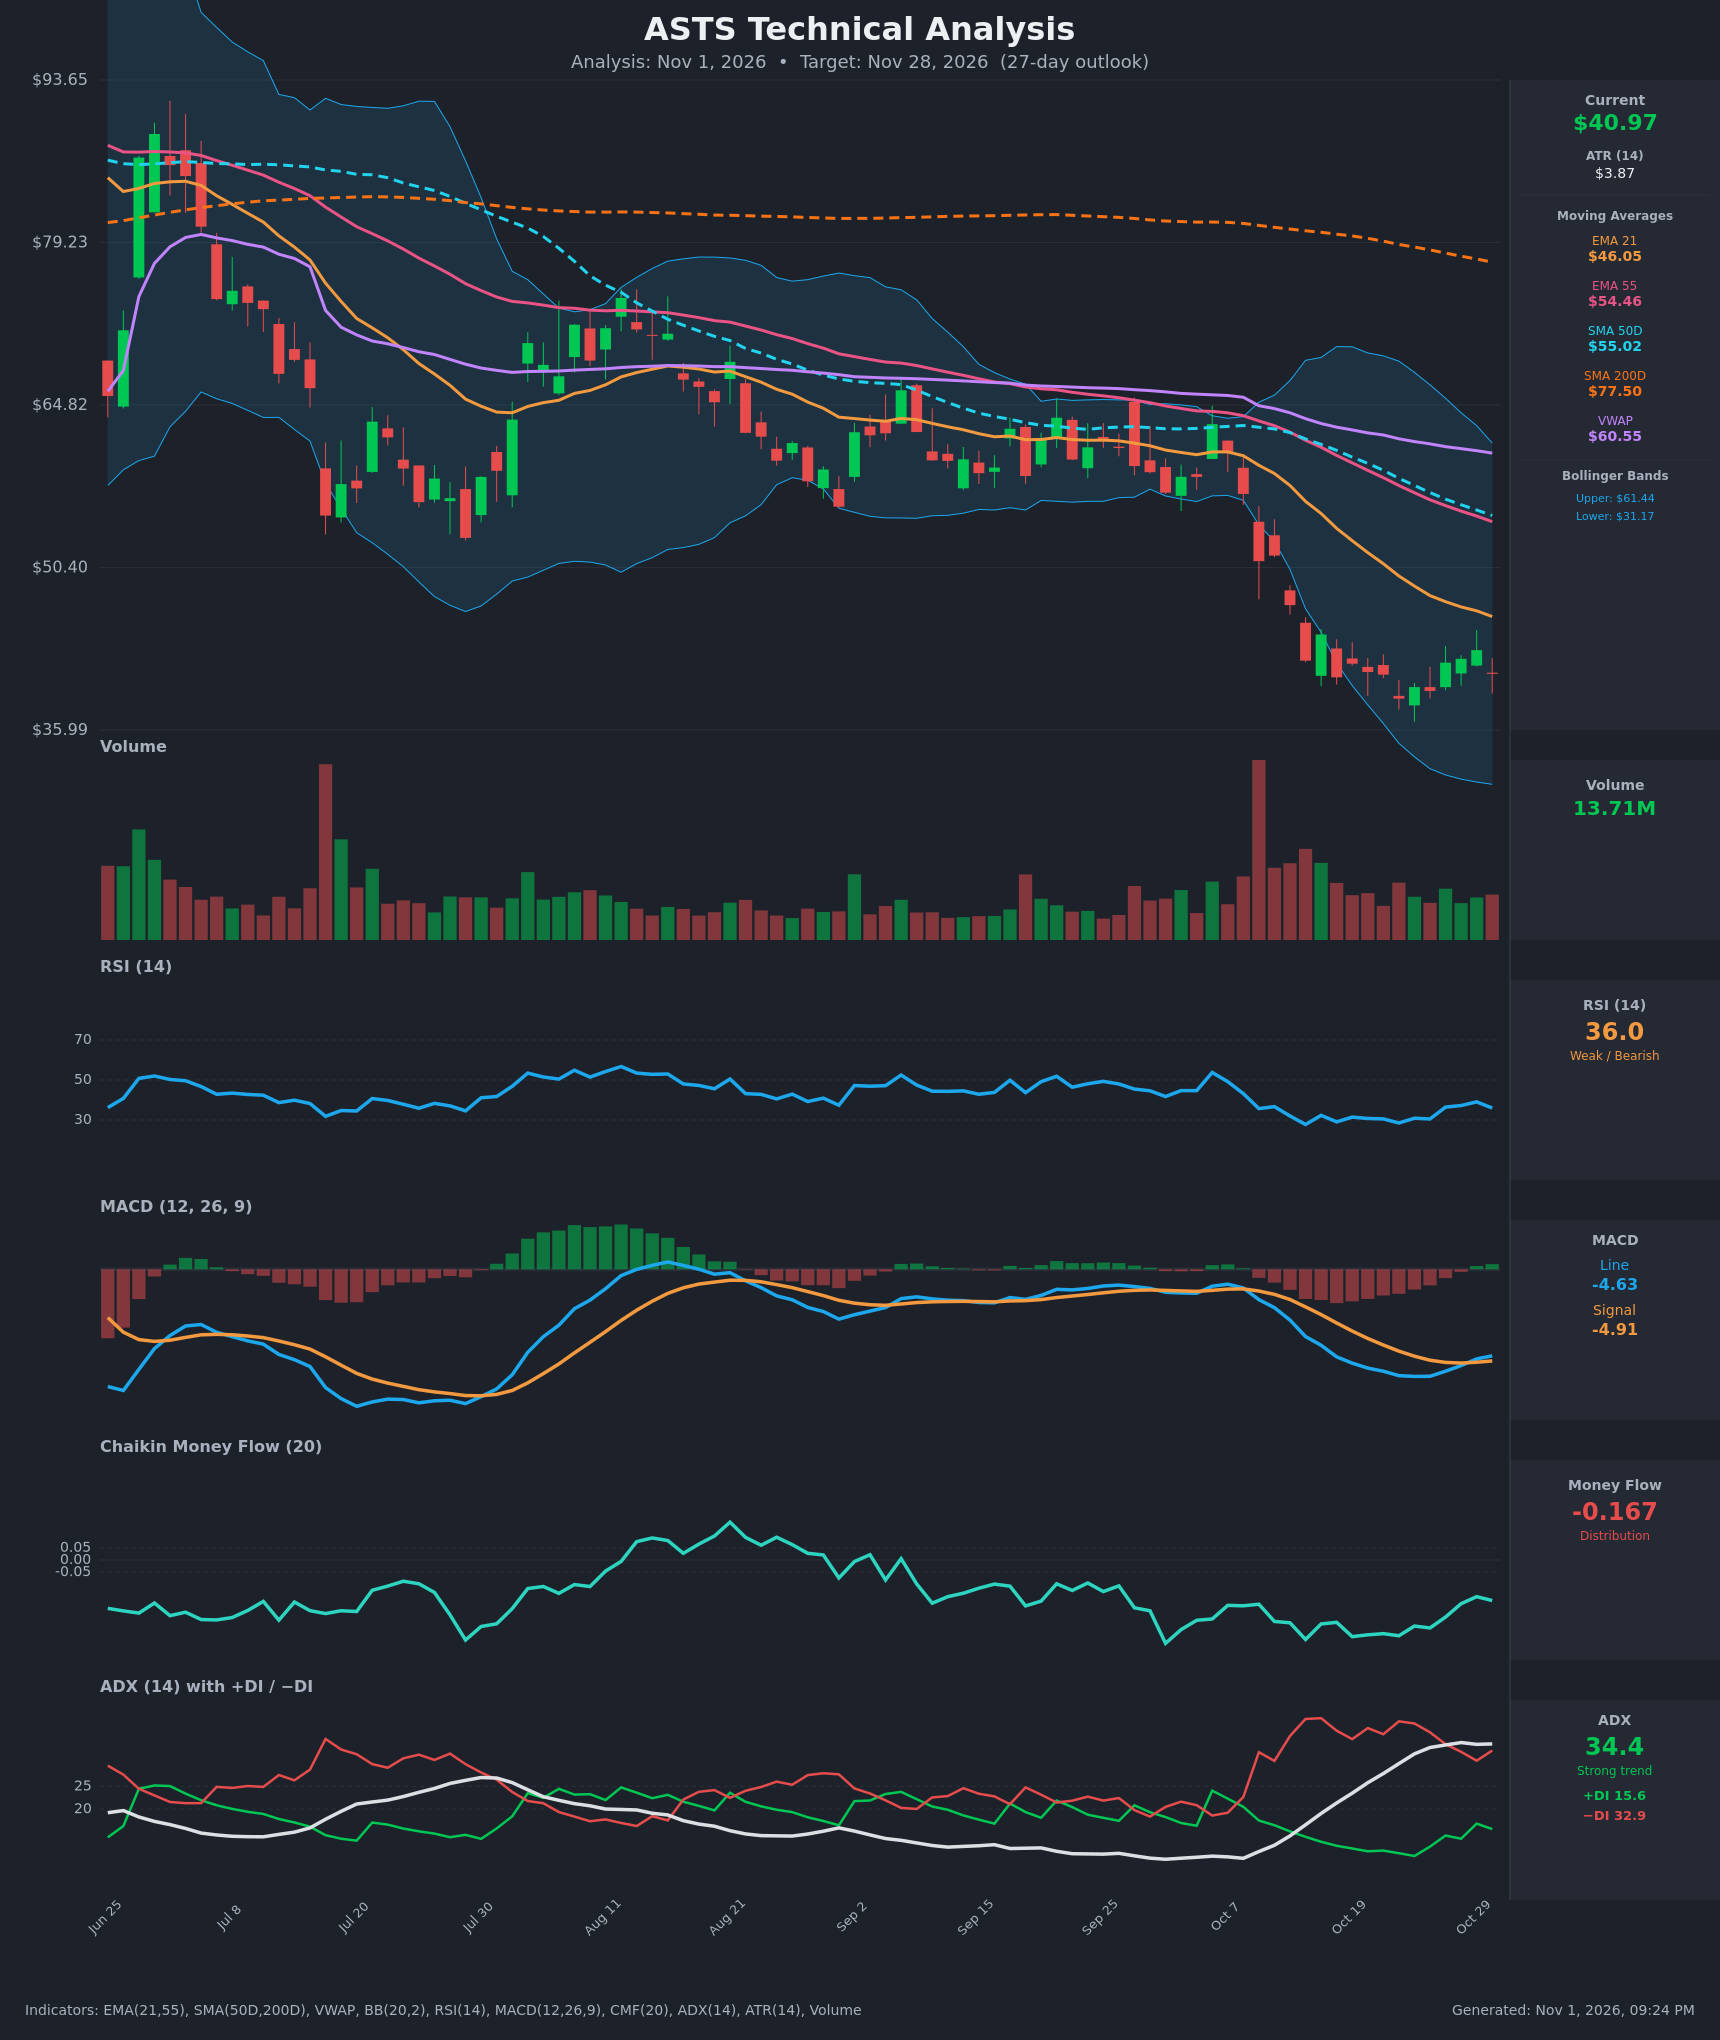
- RSI (14): 35.98, below 50 and close to oversold. It bottomed at 27.7 on Oct 14 and made a higher low near 28.5 on Oct 22. It bounced to 39.1 on Oct 29 and has now rolled over to 36.0. Momentum is weak, but selling pressure is easing. [Bearish]
- 20 EMA (EMA 21): $46.05, with price at $40.97, about 11% below it. The EMA is falling steeply (from $58.74 on Oct 12) and acts as overhead resistance. Price failed to close back above it during the bounce. [Bearish]
- MACD: Line -4.63 is just above signal -4.91, a fresh bullish crossover around Oct 28. The histogram is slightly positive and rising. The line is still deeply negative, so this is only a tentative momentum stabilization within a downtrend. [Neutral]
- Bollinger Bands (20): Upper $61.44, lower $31.17, midline about $46.3. Price is in the lower half, well below the midline, and has been walking the lower band without breaking it. Bands are wide after the October breakdown, which implies high volatility. A reversion toward the $46 midline is possible, but the trend is still down. [Bearish]
- CMF (20): -0.167, well below -0.05. It has been persistently negative (-0.15 to -0.33) throughout October, though it is improving from the -0.327 low. Distribution is still dominant. [Distribution]
- ADX (14): 34.4, a strong trend that has plateaued. −DI is at 32.9 against +DI at 15.6, so bears control. +DI has ticked up from 9.7 while −DI has eased from 40, which hints at a maturing downtrend. [Strong Trend – Bearish]
- Volume: 13.71M, below the huge capitulation spike on the Oct 7-8 breakdown. Recent bounce volume is average and unconvincing. Down days carried the heavier volume. [Bearish – no accumulation evident]
DIVERGENCES & TRENDS
- Moving average structure: Price is below EMA21 ($46.05), EMA55 ($54.46), SMA50 ($55.02), SMA200 ($77.50) and VWAP ($60.55). All are sloping down, a fully bearish stack. EMA21 is below EMA55 and SMA50 is below SMA200, a death cross already in place.
- Mild bullish RSI divergence: Price made lower lows ($38.77 on Oct 22), but RSI's low (28.5) was only marginally above its Oct 14 low (27.7). This suggests fading downside momentum but is not a clean reversal signal.
- MACD: The bullish crossover is near the zero line's far side (deeply negative), so it is a relief-bounce signal rather than a trend change.
- Price vs. DI: −DI is falling from its peak (~40), and ADX is flattening. This suggests the first leg down is exhausting, with consolidation or a bounce likely, but no +DI crossover yet.
- CMF remains negative with no accumulation divergence.
CHART PATTERNS
- The price action after the Oct 7 breakdown shows a Bearish Flag / Pennant-type consolidation (continuation). The tight range of roughly $38.8–$44 follows a sharp drop from about $60 to $40. A downside break targets the measured move, roughly $30–$32, which lines up with the lower Bollinger Band at $31.17.
- The earlier rangebound structure from July to September, which broke down in October, resembles a distribution top that has resolved lower.
- A Bullish Falling Wedge / Double Bottom is possible in the $38.8–$39.5 zone (lows on Oct 22 and Oct 26). Confirmation requires a close above about $44–$46 (EMA21), which hasn't happened.
POTENTIAL SCENARIOS
- Scenario 1: Bearish Flag Breakdown — The consolidation resolves lower as sellers retain control (−DI dominant, CMF negative, all MAs declining). Trigger: close below $38.77 (Oct 22 low) on rising volume. Target: $32–$34 (lower Bollinger Band area). Invalidation: close above $46 (EMA21). (50% probability)
- Scenario 2: Neutral Range-Bound Consolidation — Price chops between $37 and $46 as the oversold bounce stalls at EMA21 while downside momentum fades. Trigger: failure to break either $38.77 or $46. Target: $38–$45. Invalidation: close outside the range on volume. (20% probability)
- Scenario 3: Bullish Relief Rally / Double Bottom — The MACD crossover and RSI higher low lead to a mean reversion toward the BB midline. Trigger: close above $44.5 with improving volume and CMF. Target: $46–$50 (EMA21, then gap/resistance near $50). Invalidation: close below $38.77. (30% probability)
PRICE TARGETS
For the 27-day timeframe the range width should be roughly 12–18% of price, with some allowance for ATR/volatility: 27 days at an ATR of $3.87 implies a typical swing of about ±$10–$13. A range of about $31.50 to $47.00 is $15.50 wide, 37.8% of price, wider than guidance, but justified by the very high volatility (ATR is about 9.4% of price). To stay closer to the guidance while still reflecting volatility I use a range of $33.00 to $46.00, which is $13.00 wide, or about 31.7%.
Self-check: the width of $13.00 is about 31.7% of $40.97. This is above the standard 12–18% band because ATR is about 9.4% of price, and the range remains far wider than any 2–14 day range.
- Target Price: $37.50 (27 days)
- Expected Range: $33.00 to $46.00
- Key Levels: Support at $38.77 (then $31.17 lower Bollinger Band), Resistance at $46.05
OVERALL BIAS
OVERALL BIAS: BEARISH - Price is below every moving average, with −DI far above +DI (ADX 34), persistent CMF distribution (-0.167) and a bear-flag-type consolidation after the October breakdown. The MACD crossover and the mild RSI divergence suggest bounces are possible, but the most likely path is a downside resolution toward the low-to-mid $30s.
This is educational analysis and not financial advice.