INTC 27-day bearish forecast — Nov 1, 2026
- Bias: Bearish
- Timeframe: 27 days (made Nov 1, 2026, target date Nov 27, 2026)
- Price at analysis: $65.76
- Price target: $62.50
- Expected range: $57.50 – $69.50
- Result: Pending — graded after the close on Nov 27, 2026
Get a free AI analysis of INTC today
Analysis
TECHNICAL INDICATORS
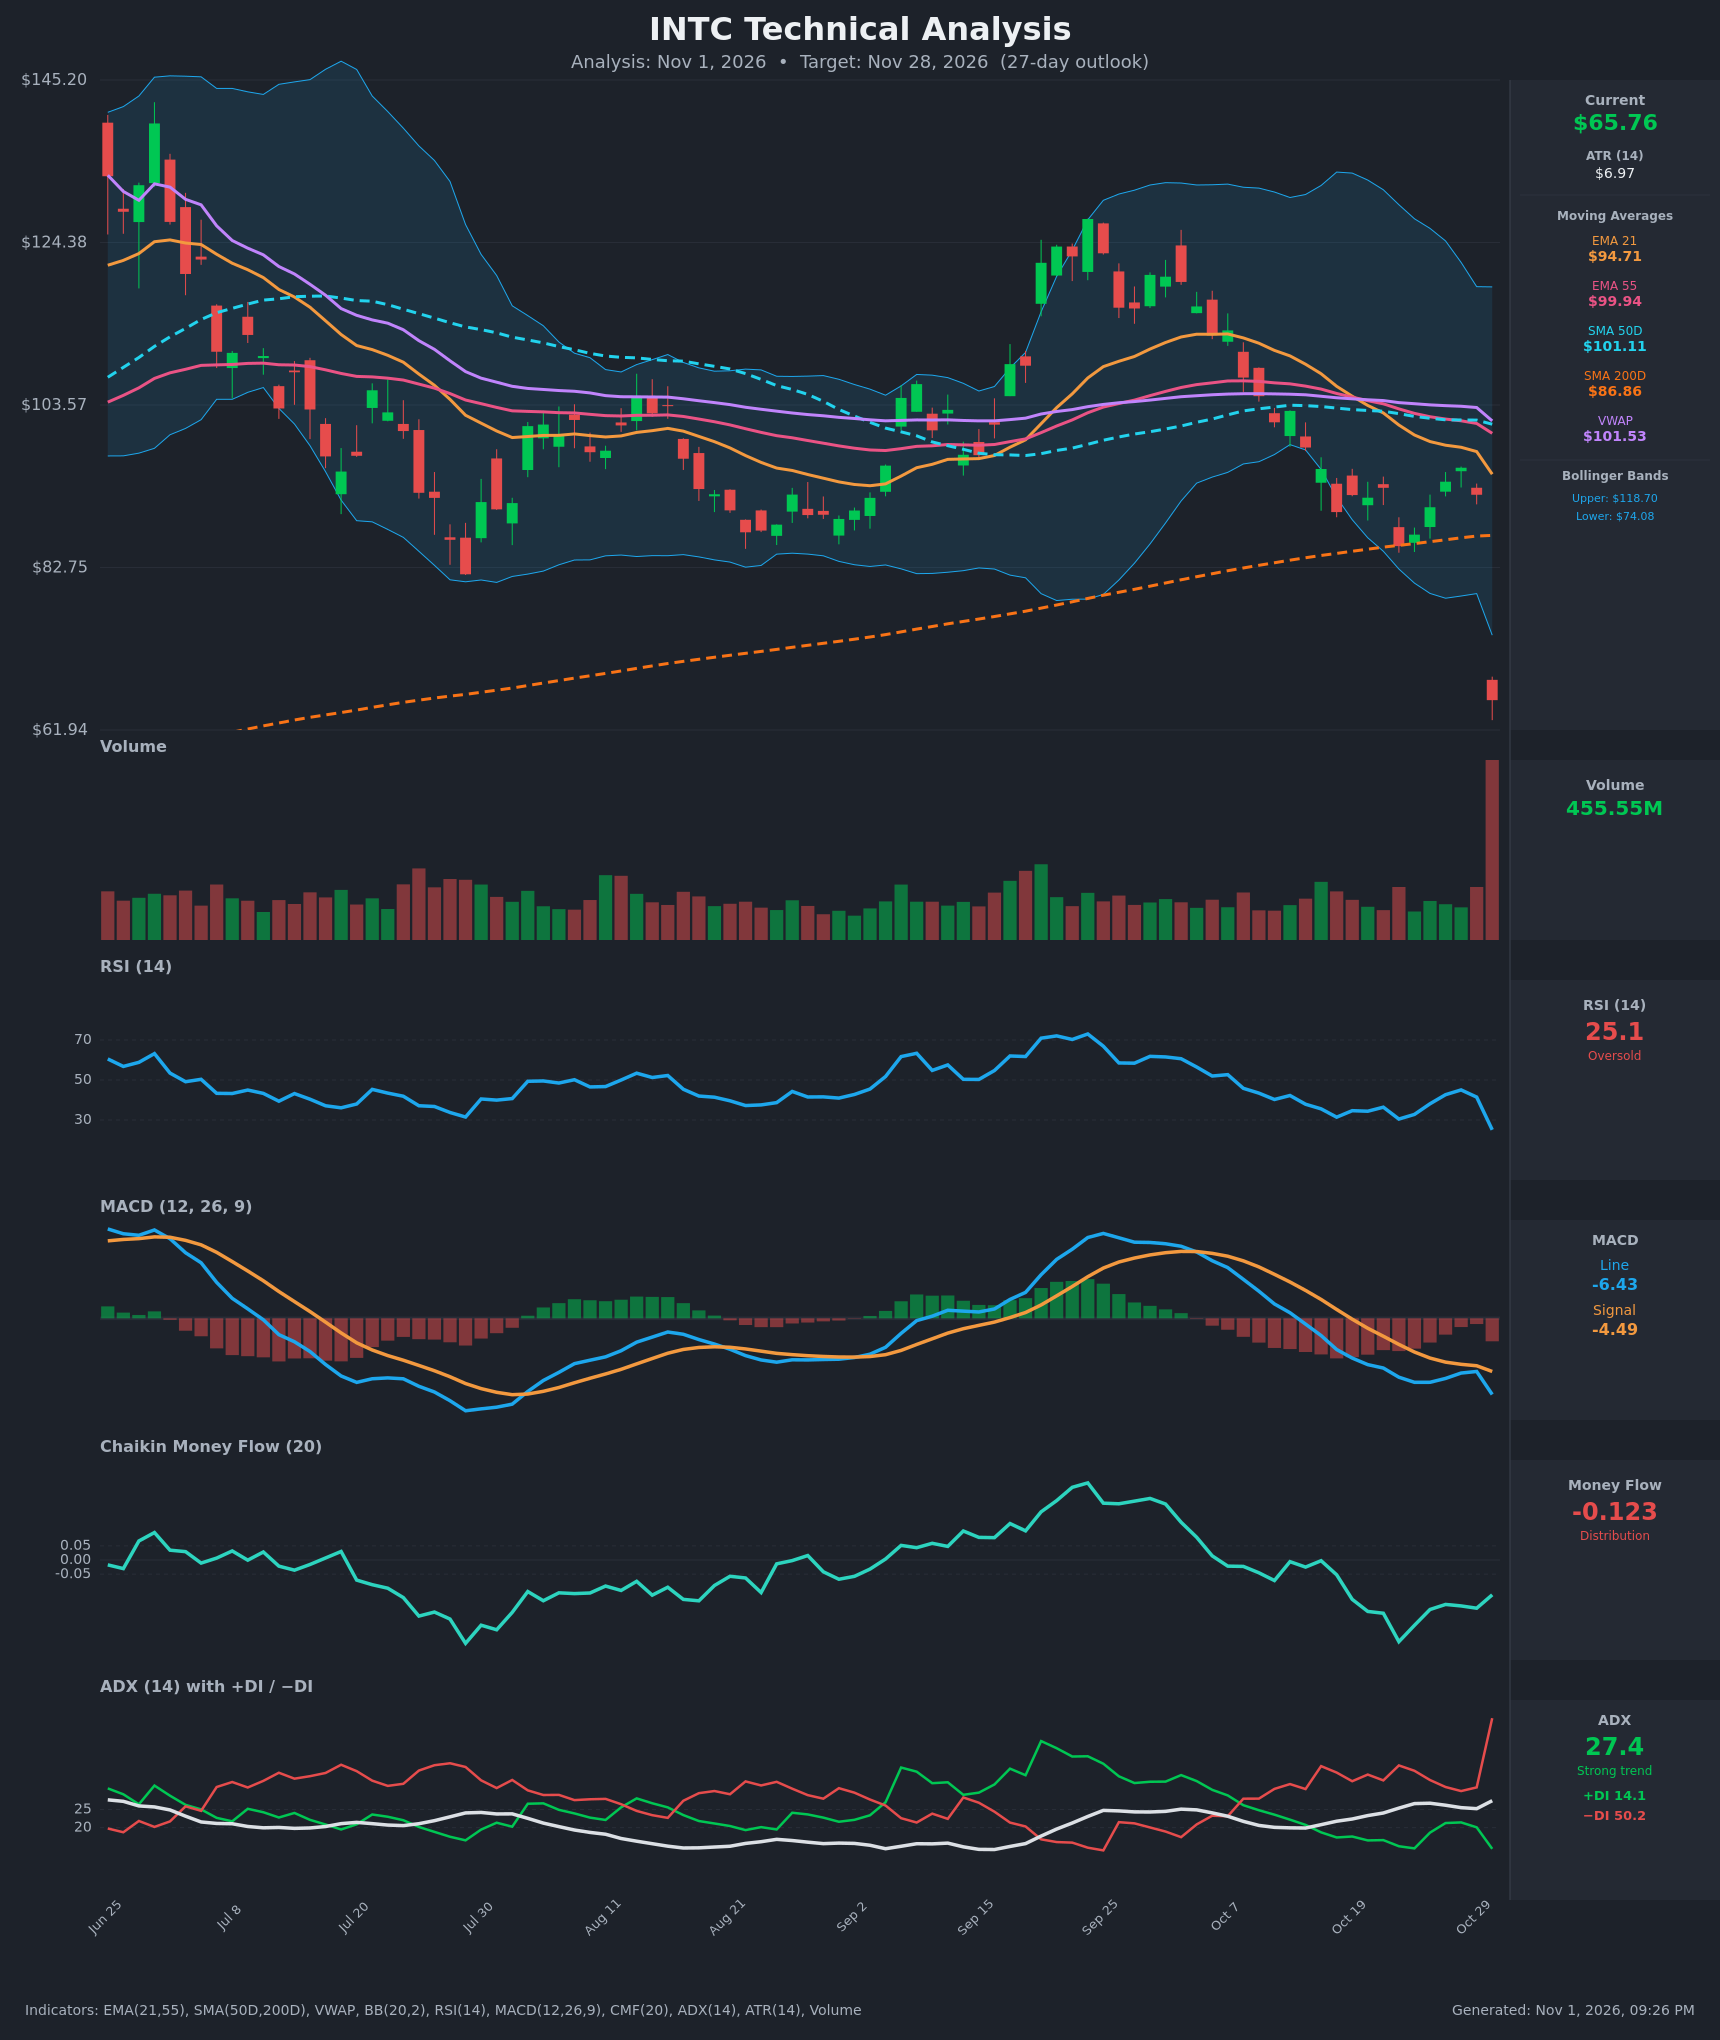
- RSI (14): 25.10, deeply oversold and down from 41.5 the prior day. The one-day collapse took it to its lowest reading in the visible period. Oversold readings can bounce, but in strong downtrends RSI often stays pinned below 30. [Bearish]
- 20 EMA: The data supplies the 21 EMA at $94.71, sitting above the $65.76 price, about 31% overhead. EMA21 is below EMA55 ($99.94), a bearish alignment, and it is now steeply declining resistance. [Bearish]
- MACD: The line is -6.43, below the signal at -4.49, and the histogram is about -1.94 and expanding. The bearish crossover happened on Oct 19. Momentum is accelerating downward again after a brief recovery in the histogram. [Bearish]
- Bollinger Bands (20): The bands are $74.08 to $118.70. Price is about 11% below the lower band, an extreme statistical deviation after a roughly 29% one-day drop. Bands are wide, so volatility has expanded. Such extremes often bring a snap-back toward the lower band, but the "band walk" risk is real. [Bearish]
- CMF (20): -0.123, below the -0.05 threshold. It has been negative for most of October, which shows persistent distribution. The gap-down volume is likely to deepen this. [Distribution]
- ADX (14): 27.4 and rising, so the trend is strong. −DI at 50.2 is far above +DI at 14.1. Sellers are firmly in control, and −DI has spiked sharply. [Strong Trend – Bearish]
- Volume: 455.55M, by far the largest bar on the chart and several times the normal average. A volume spike on a large gap-down is a capitulation or repricing event, likely news-driven. It confirms the breakdown, though it can also mark an exhaustion low. [Bearish – high-volume breakdown]
DIVERGENCES & TRENDS
- There is no bullish RSI or MACD divergence. Both made new lows along with price, so momentum confirms the move.
- Price fell from $92.07 to $65.76 in one session, a gap through the $85.49 swing low and the $86.86 SMA200. That breaks the long-term uptrend support. Price is now below every moving average.
- The EMA21/EMA55 bearish cross is established. SMA50D ($101.11) is still above SMA200D ($86.87), so there is no death cross yet. It could develop if price stays depressed, but SMA50 would need about a month to fall that far.
- MACD has been below its signal since Oct 19, and the histogram is re-expanding. CMF has been in distribution since mid-October. The −DI spike with a rising ADX shows an impulsive, directional move.
- VWAP at $101.53 is far above price. Anyone buying in the last several weeks is underwater, which creates heavy overhead supply.
- The only counter-signal is the stretched, oversold condition (RSI 25, price below the lower BB). That favors a bounce attempt but does not by itself reverse the trend.
CHART PATTERNS
- Bearish Double Top (reference diagram): The Sep 25 and early-Oct highs near $125-127 formed a double top. The neckline near $103 broke through October, and the measured move target near $75-80 has now been exceeded.
- Gap-down breakdown: This is not a classic diagram pattern. Gaps like this often lead to a dead-cat bounce into the gap zone, roughly $75-$85, followed by a retest of the low.
- Support: The long-term SMA200 rising line, once support, is now overhead resistance near $87.
- Possible base: A Bullish Double Bottom would only form if price retests the $62-$64 low and holds on lower volume. That is not yet visible.
POTENTIAL SCENARIOS
- Scenario 1: Bearish Post-Gap Drift and Retest — After a brief relief bounce, sellers cap rallies at $70-$74 (lower Bollinger Band zone) and price drifts lower as distribution continues and −DI stays dominant. Trigger: failure to reclaim $70-$72 and a break below the $62 post-gap low. Target: $62.50, with extension to about $57.50. Invalidation: a daily close above $74.08 with CMF turning positive. (47% probability)
- Scenario 2: Bullish Oversold Relief Rally — Extreme RSI and band deviation after capitulation volume trigger a mean-reversion bounce toward the lower band and the gap. Trigger: a hold above $62 with a rising RSI above 35 and a close above $70. Target: $74-$78. Invalidation: a break below $62. (38% probability)
- Scenario 3: Neutral Volatile Base — Price consolidates in a wide $60-$70 range as the market digests the news. Trigger: contracting volume and an ADX decline. Target: $63-$68. Invalidation: a close outside $59-$72. (15% probability)
PRICE TARGETS
- Target Price: $62.50 (27-day outlook)
- Expected Range: $57.50 to $69.50. The $12.00 width is about 18% of the current price, appropriate for 27 days and consistent with an ATR of about $7.
- Key Levels: Support at $62.00, Resistance at $74.08
OVERALL BIAS
OVERALL BIAS: BEARISH - Price gapped down about 29% on record volume and sits below every moving average. MACD is below its signal, −DI (50.2) dominates a rising ADX (27.4), and CMF shows distribution. Oversold RSI raises the odds of a relief bounce, but trend and overhead supply favor a drift lower or a retest of the post-gap low.
This is educational analysis and not financial advice.