META 27-day bearish forecast — Nov 1, 2026
- Bias: Bearish
- Timeframe: 27 days (made Nov 1, 2026, target date Nov 27, 2026)
- Price at analysis: $614.99
- Price target: $598.00
- Expected range: $552.00 – $646.00
- Result: Pending — graded after the close on Nov 27, 2026
Get a free AI analysis of META today
Analysis
TECHNICAL INDICATORS
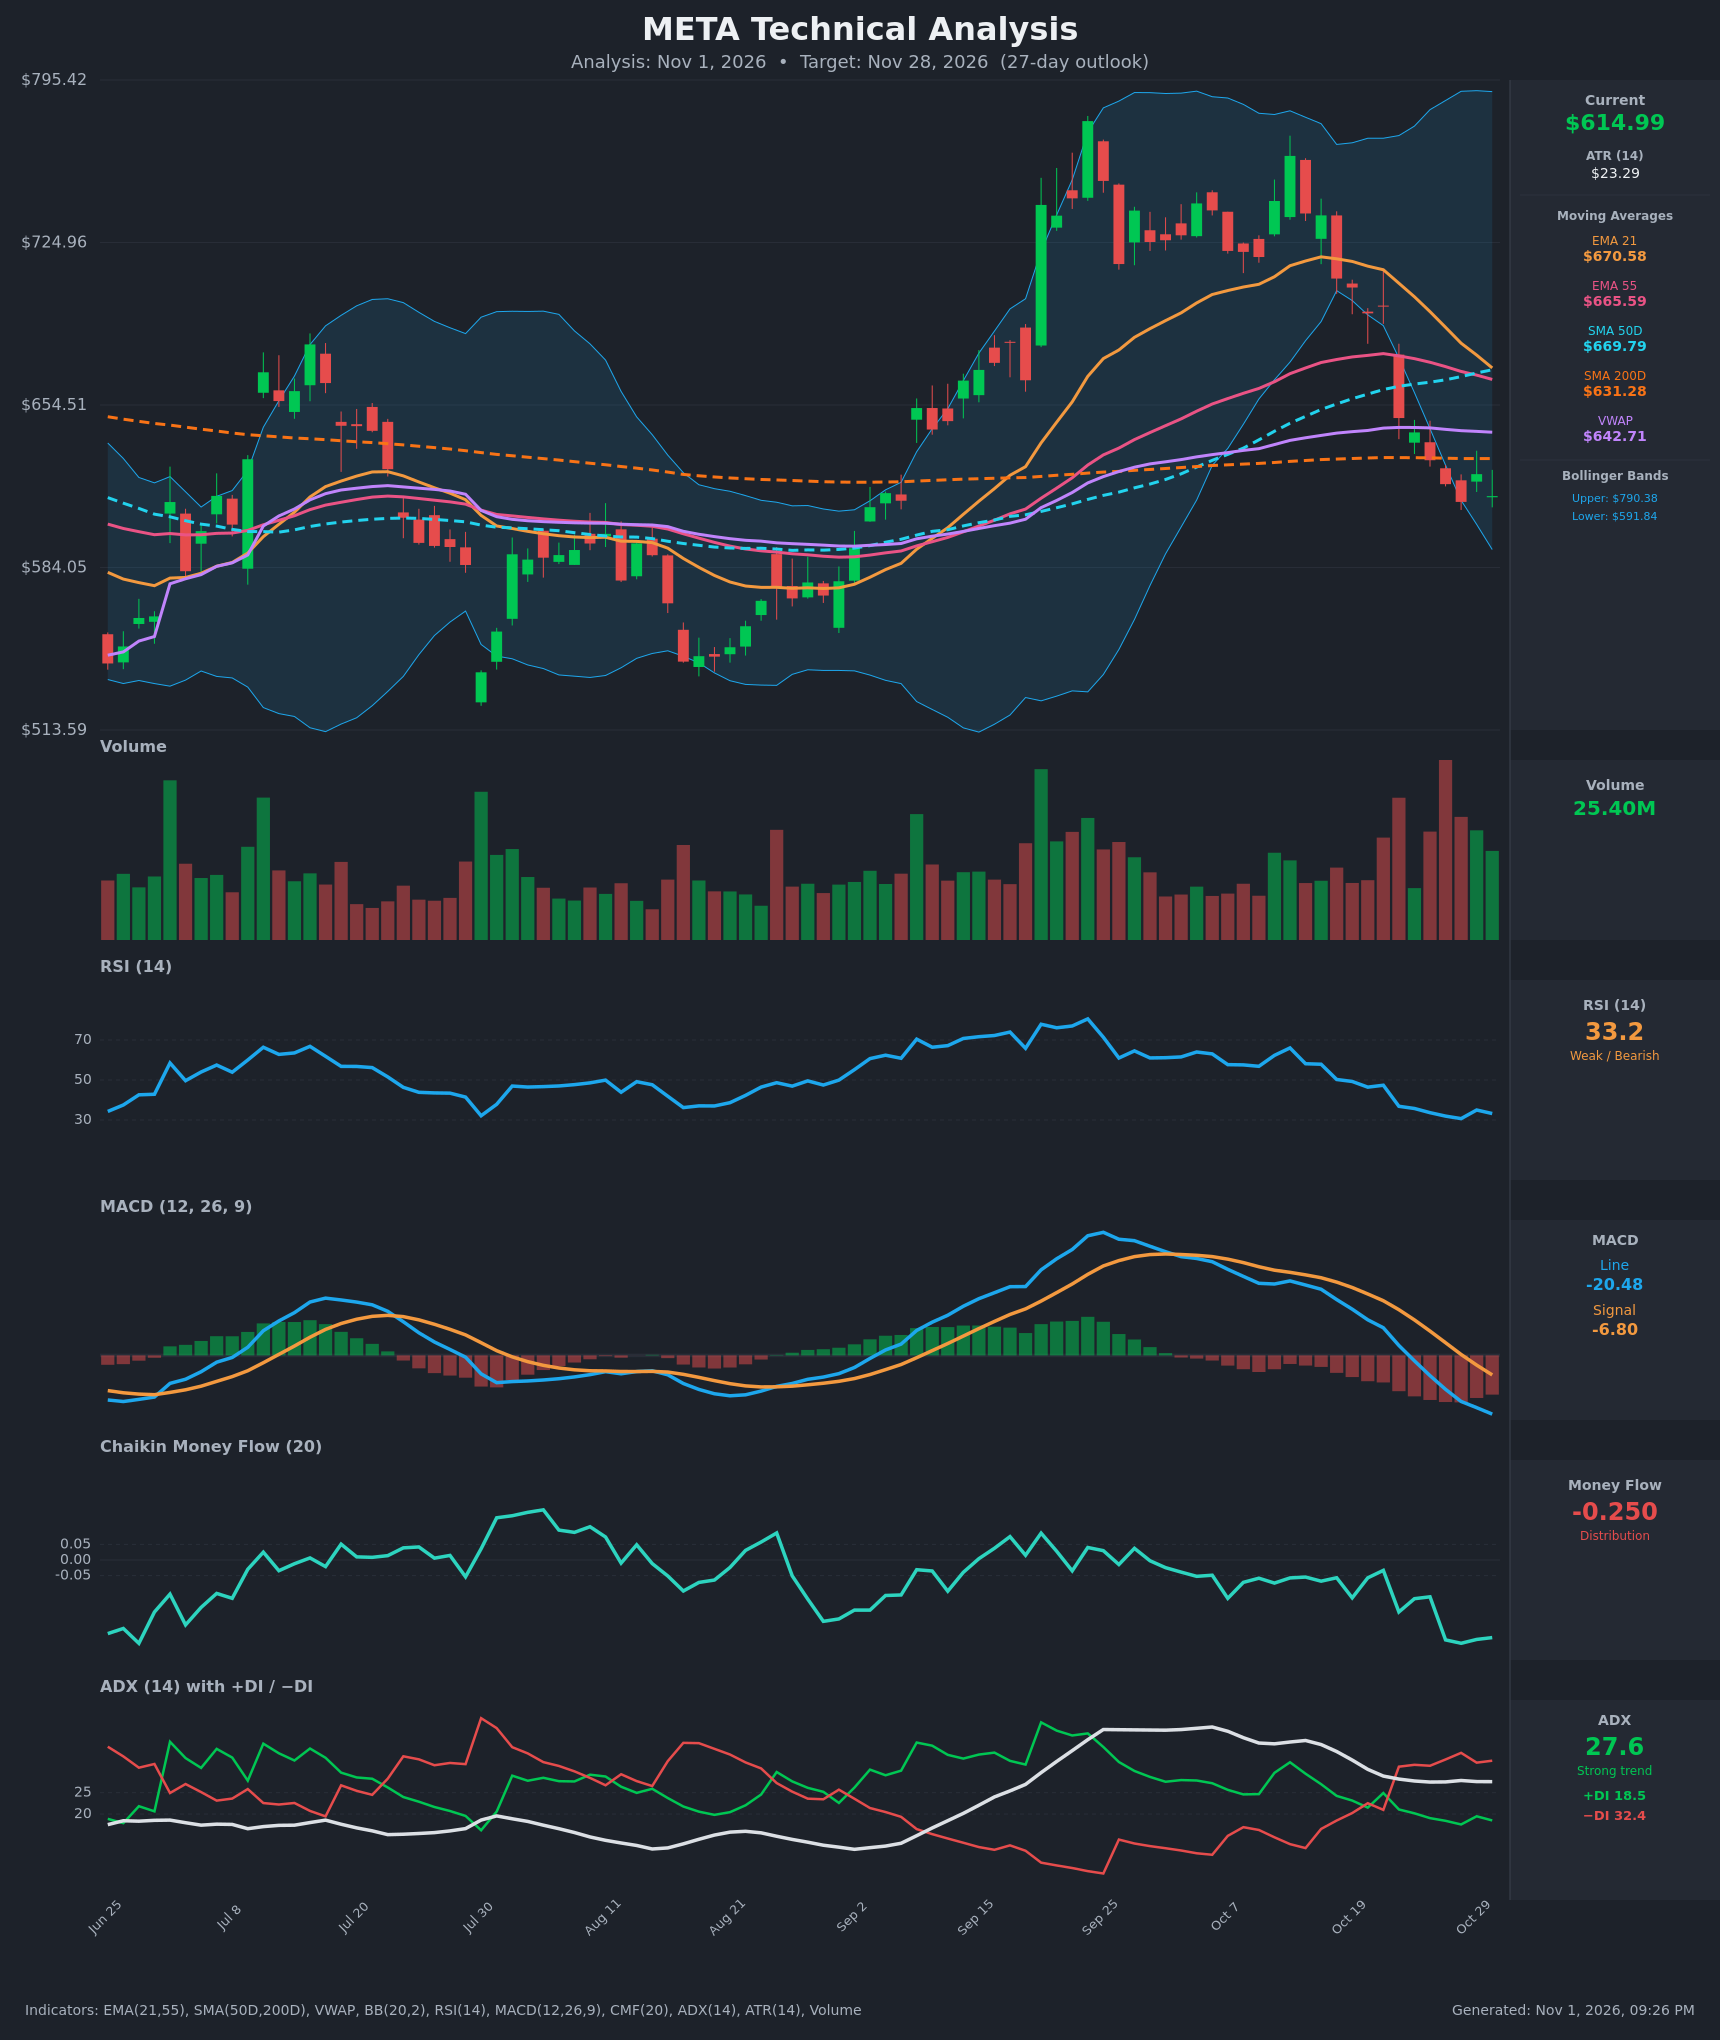
- RSI (14): 33.23, just above the 30 oversold line. It has fallen from 66 on Oct 13 and is making lower lows. The reading is weak and near oversold, so a short-term bounce is possible, but there is no bullish momentum yet. [Bearish]
- 20 EMA (EMA 21): $670.58, about 9% above the $614.99 price. The EMA has rolled over from $718.74 and now acts as resistance. EMA21 is also converging on EMA55 ($665.59) and is about to cross below it. [Bearish]
- MACD: Line -20.48 is below Signal -6.80, and the gap is widening. The line crossed below zero on Oct 23, and the histogram is negative and growing. There is no sign of bullish momentum recovery. [Bearish]
- Bollinger Bands (20): Upper $790.38, lower $591.84. Price sits in the lower quarter of the bands, about 3.9% above the lower band. The bands are wide, which reflects high volatility after the swing from $780 to $615. Walking the lower band is bearish, but a test of $592 could trigger a reflex bounce. [Bearish]
- CMF (20): -0.250, deep in distribution territory and near the lowest level on the chart. It has been below -0.05 for the whole 15-bar window. Selling pressure is persistent, with no accumulation. [Distribution]
- ADX (14): 27.6 with -DI 32.4 above +DI 18.5. The trend is strong and the sellers are in control. ADX is holding above 25 while the -DI/+DI spread is wide. [Strong Trend – Bearish]
- Volume: 25.40M, with heavy volume on the red days during the Oct 22-28 selloff. Distribution volume confirms the breakdown. The latest small green bar shows only tentative buying. [Bearish – selling confirmed by volume]
DIVERGENCES & TRENDS
- There is no bullish RSI or MACD divergence. Both are making lower lows alongside price, which confirms the downtrend.
- The Sep 25 price peak was not matched by MACD, which peaked earlier. That mild bearish divergence preceded this drop.
- The EMA21 is about to cross below EMA55 (670.58 vs 665.59). SMA50D ($669.79) is also being tested from below by price and the EMAs. The SMA50D/SMA200D golden cross remains intact at $669.79 vs $631.28, but the gap is narrowing.
- Price is below SMA200D ($631.28) for the first time since the late-Aug/Sep base. Price is also below VWAP ($642.71). Together these show a loss of long-term support.
- The MACD bearish crossover occurred around Oct 23, and the -DI/+DI bearish crossover happened on Oct 22. Both are confirmed and still widening.
- ADX is turning the trend direction from up to down. RSI has hovered at 30-35 for six sessions. That is a sign of persistent selling, not exhaustion.
CHART PATTERNS
- Bearish Double Top (reversal): Peaks near $780 (Sep 25) and about $760 (Oct 13) failed to make a new high. The neckline was broken in the Oct 20-22 decline. Price has since slid well past the pattern's measured target, which means momentum is strong.
- Price is now near the Aug-Sep consolidation zone, roughly $584-$600. That area acted as a base before the September rally and is the most likely support. A break below the lower Bollinger Band ($592) would open a retest of $584 and then the low $570s.
- A Bearish Flag / Pennant could form if price consolidates just under $631-$645, with a continuation target in the high $550s to $570s.
POTENTIAL SCENARIOS
- Scenario 1: Bearish Trend Continuation — Sellers remain in control (−DI > +DI, CMF -0.25, MACD falling). Price weakens through the lower band and tests the Aug-Sep base. Trigger: daily close below $591.84 (lower BB), then below $584. Target: $585-$600 by Nov 28, extending to $560 on a break. Invalidation: daily close above $645 (above VWAP and SMA200D). (50% probability)
- Scenario 2: Bullish Oversold Bounce — RSI near 30 and price at the lower band trigger a mean-reversion rally toward the moving-average cluster. The bounce is a counter-trend relief move that stalls below the falling EMAs. Trigger: reclaim of SMA200D ($631.28) on rising volume with a CMF turn above -0.05. Target: $645-$670 (VWAP, then EMA21/SMA50D cluster). Invalidation: close back below $600. (33% probability)
- Scenario 3: Neutral Base Building — Price chops between $585 and $635 as selling exhausts and buyers defend the Aug-Sep base. Trigger: a series of inside days with ADX falling below 25. Target: $600-$625. Invalidation: a close outside $580-$645. (17% probability)
PRICE TARGETS
- Target Price: $598.00 (27-day, Nov 28, 2026)
- Expected Range: $552.00 to $646.00 (width $94, about 15.3% of the current price, consistent with the 12-18% guidance for 30-60 days and scaled slightly lower for 27 days)
- Key Levels: Support at $584.00, Resistance at $631.28
OVERALL BIAS
OVERALL BIAS: BEARISH - Price is below all key moving averages including SMA200D and VWAP. MACD, CMF (-0.25) and ADX/DI (-DI 32.4 vs +DI 18.5) all confirm strong selling pressure. Oversold RSI and the lower Bollinger Band raise bounce risk, but the bounce is likely to fade below the $631-$670 resistance zone.
This is educational analysis and not financial advice.