MU 27-day bearish forecast — Nov 1, 2026
- Bias: Bearish
- Timeframe: 27 days (made Nov 1, 2026, target date Nov 27, 2026)
- Price at analysis: $884.74
- Price target: $835.00
- Expected range: $770.00 – $925.00
- Result: Pending — graded after the close on Nov 27, 2026
Get a free AI analysis of MU today
Analysis
TECHNICAL INDICATORS
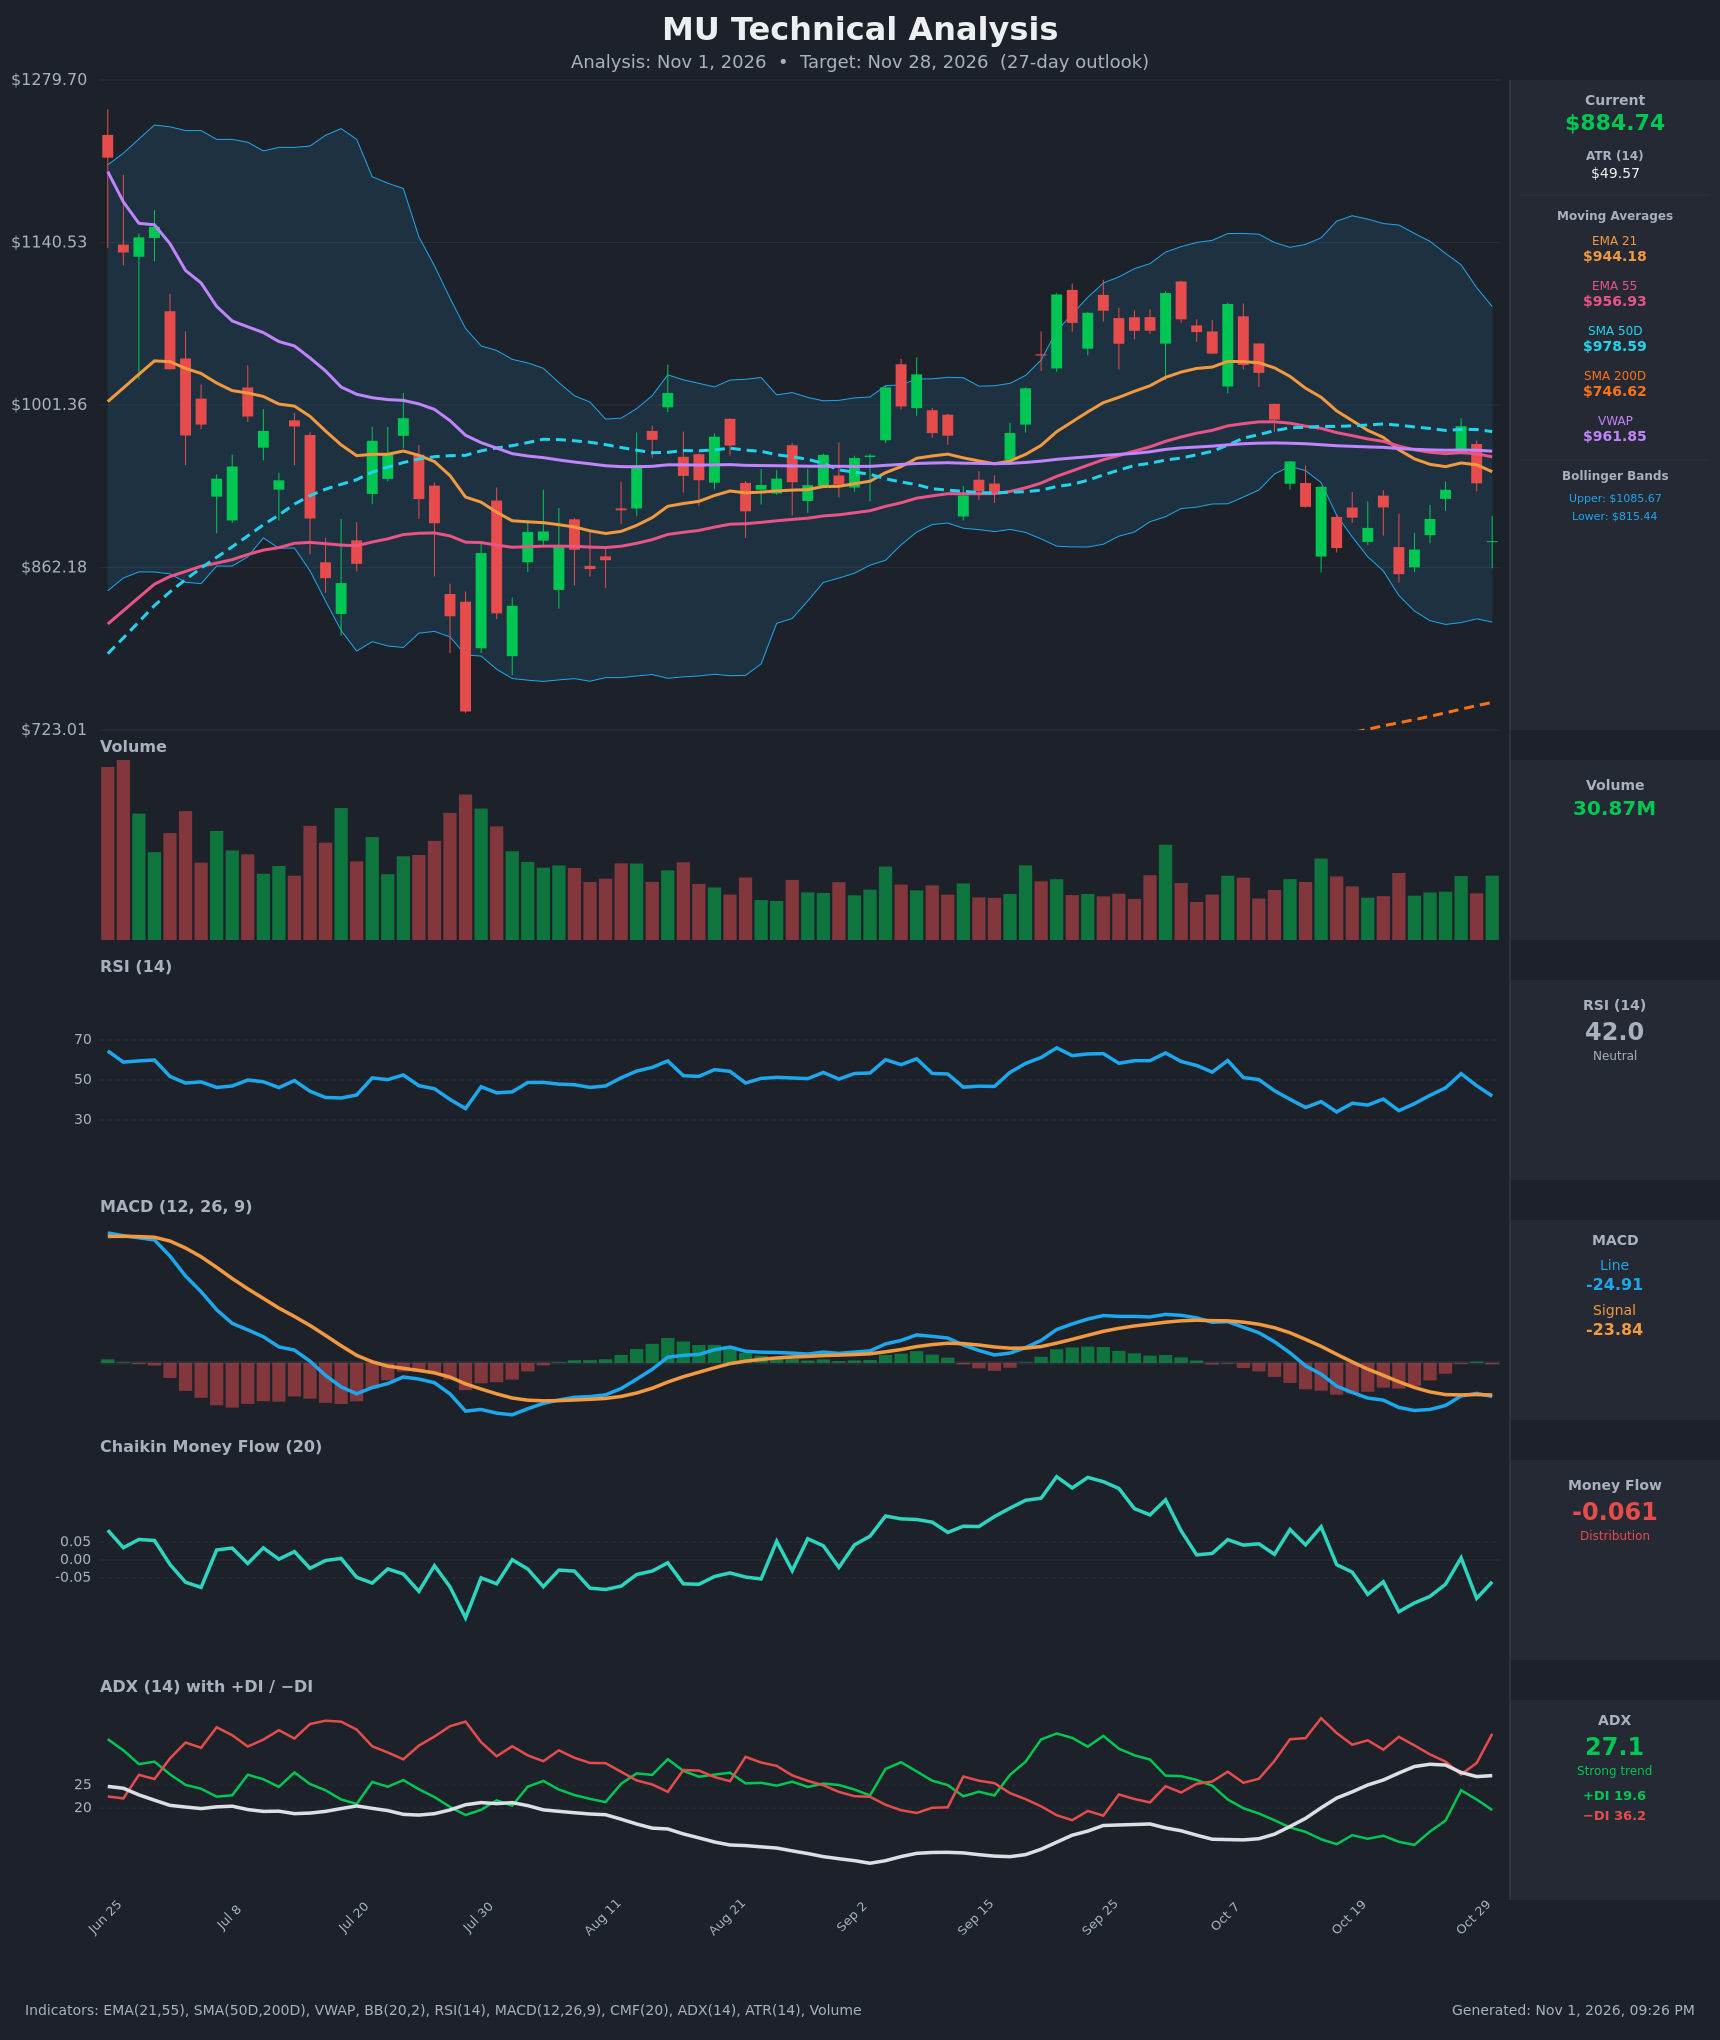
- RSI (14): 41.98, below the 50 midline but not oversold. It peaked at 53.2 on Oct 28 and has rolled over to 42.0. The 34-38 zone has repeatedly marked short-term lows (Oct 16, Oct 22). Momentum is weak but not washed out, so there is room to fall further. [Bearish]
- 20 EMA: The supplied value is EMA 21 at $944.18, and price ($884.74) is about 6.3% below it. EMA 21 is also below EMA 55 ($956.93) and SMA 50D ($978.59), a bearish stack. The Oct 28 rally to $983 failed at the declining EMA 21/EMA 55 zone, so the EMAs act as overhead resistance. [Bearish]
- MACD: Line -24.92 is below Signal -23.84, giving a slightly negative histogram. The line crossed below the signal around Oct 19-20 and has been in negative territory since. The Oct 26-28 bounce narrowed the gap to nearly zero, but the line has now rolled over again, which confirms the downside momentum. [Bearish]
- Bollinger Bands (20): Upper $1085.67, lower $815.44, midline about $950. Price sits in the lower third of the band, roughly 26% of the way up from the lower band. The bands are contracting from their September expansion. Price is well below the midline, which has capped rallies. There is no oversold extreme yet, and a walk down the lower band is possible. [Bearish]
- CMF (20): -0.061, below the -0.05 threshold and mostly negative since Oct 16. The brief positive readings on Oct 13-15 and Oct 28 did not hold. Sellers dominate on a volume-weighted basis. [Distribution]
- ADX (14): 27.1, above the 25 trend threshold and rising from 14.3 on Oct 12. −DI at 36.2 is far above +DI at 19.6, and the spread widened again on the latest bar after a brief narrowing on Oct 28. This is a strong, established downtrend. [Strong Trend – Bearish]
- Volume: 30.87M, roughly average relative to recent sessions. The Oct 28 bounce did not come with a decisive volume surge, while the declines on Oct 22 and Oct 30 carried comparable or heavier participation. Moves down look more convincing than moves up. [Mildly Bearish]
DIVERGENCES & TRENDS
- No bullish divergence yet. RSI made lows of 34.0 (Oct 16) and 34.7 (Oct 22), and the Oct 22 low of $856.49 was below the Oct 16 low of $878.84. RSI roughly matched its low rather than making a higher low, so there is no clean reversal signal.
- MACD has been below zero since Oct 14 and below its signal since Oct 20. The attempt to close the gap on Oct 28 failed, a classic failed-rebound pattern.
- EMA crossover: EMA 21 crossed below EMA 55 on Oct 22, a bearish trend signal that is still intact.
- SMA 50D vs 200D: The 50D ($978.59) is far above the rising 200D ($746.62), so there is no death cross. Price remains above the SMA 200D, so the long-term trend is still up, but the medium-term trend has turned down.
- VWAP at $961.85: Price is about 8% below VWAP, so sellers hold control and rallies into the $945-$985 zone are likely to meet supply.
- ADX/DI: −DI has been above +DI since Oct 12, and the Oct 28 bounce failed to produce a bullish DI crossover (+DI peaked at 23.9 vs −DI 27.3).
- Price structure: Lower highs (about $1,085 in early October, $983 on Oct 28) and lower lows ($856 on Oct 22) show a clear short-term downtrend.
CHART PATTERNS
- Primary pattern: a bearish continuation structure resembling a Bearish Descending Triangle / lower-highs sequence against support at about $856. Price has made a series of lower highs while testing the $856-$880 floor. A decisive close below $856 would break the floor, and the measured move points to roughly $800-$815 (the lower Bollinger Band area).
- Secondary read: the Oct 28 spike to $983 and rejection resembles a failed bull flag / bearish pennant retest of the broken EMA/SMA zone.
- Larger context: from August to early October, price traded in a broad $860-$1,100 range, with a possible Bearish Double Top forming near $1,085 and $1,060 before the breakdown. The measured target of a break below the $860 neckline is roughly $640-$700, but that is far beyond the 27-day horizon. The SMA 200D near $747 acts as a longer-term magnet.
POTENTIAL SCENARIOS
- Scenario 1: Bearish Breakdown Continuation — Sellers keep control (−DI 36 vs +DI 20, MACD negative, CMF in distribution), and price breaks the $856 swing low and slides toward the lower Bollinger Band. Trigger: daily close below $856.49 with expanding volume. Target: $800-$815, with an extension toward $775. Invalidation: daily close above $944 (EMA 21). (55% probability)
- Scenario 2: Neutral Range Chop — Price oscillates between $856 support and the $940-$950 resistance cluster as ADX cools and the bands contract. Trigger: holds $856 on a retest with RSI turning up from the mid-30s. Target: $870-$930 range. Invalidation: close below $850 or above $960. (15% probability)
- Scenario 3: Bullish Relief Rally — Oversold bounce reclaims the moving averages and tests the broader range. Trigger: close above $944-$957 (EMA 21/55) with MACD crossing above its signal and CMF turning positive. Target: $978-$985 (SMA 50D / Oct 28 high), possibly $1,000. Invalidation: close back below $880. (30% probability)
PRICE TARGETS
- Target Price: $835.00 (27-day horizon, about -5.6% from the current $884.74)
- Expected Range: $770.00 to $925.00 (width $155, about 17.5% of current price, consistent with the 12-18% guidance for a 30-60 day-type window)
- Key Levels: Support at $856.49, Resistance at $944.18
OVERALL BIAS
OVERALL BIAS: BEARISH - Price is below the EMA 21/55, SMA 50D and VWAP, with a negative MACD, CMF in distribution, and ADX at 27 with −DI (36.2) far above +DI (19.6). A break of the $856 swing low points toward $800-$815, while the SMA 200D near $747 offers longer-term support.
This is educational analysis and not financial advice.