USO 27-day bullish forecast — Nov 1, 2026
- Bias: Bullish
- Timeframe: 27 days (made Nov 1, 2026, target date Nov 27, 2026)
- Price at analysis: $168.83
- Price target: $172.50
- Expected range: $154.00 – $182.00
- Result: Pending — graded after the close on Nov 27, 2026
Get a free AI analysis of USO today
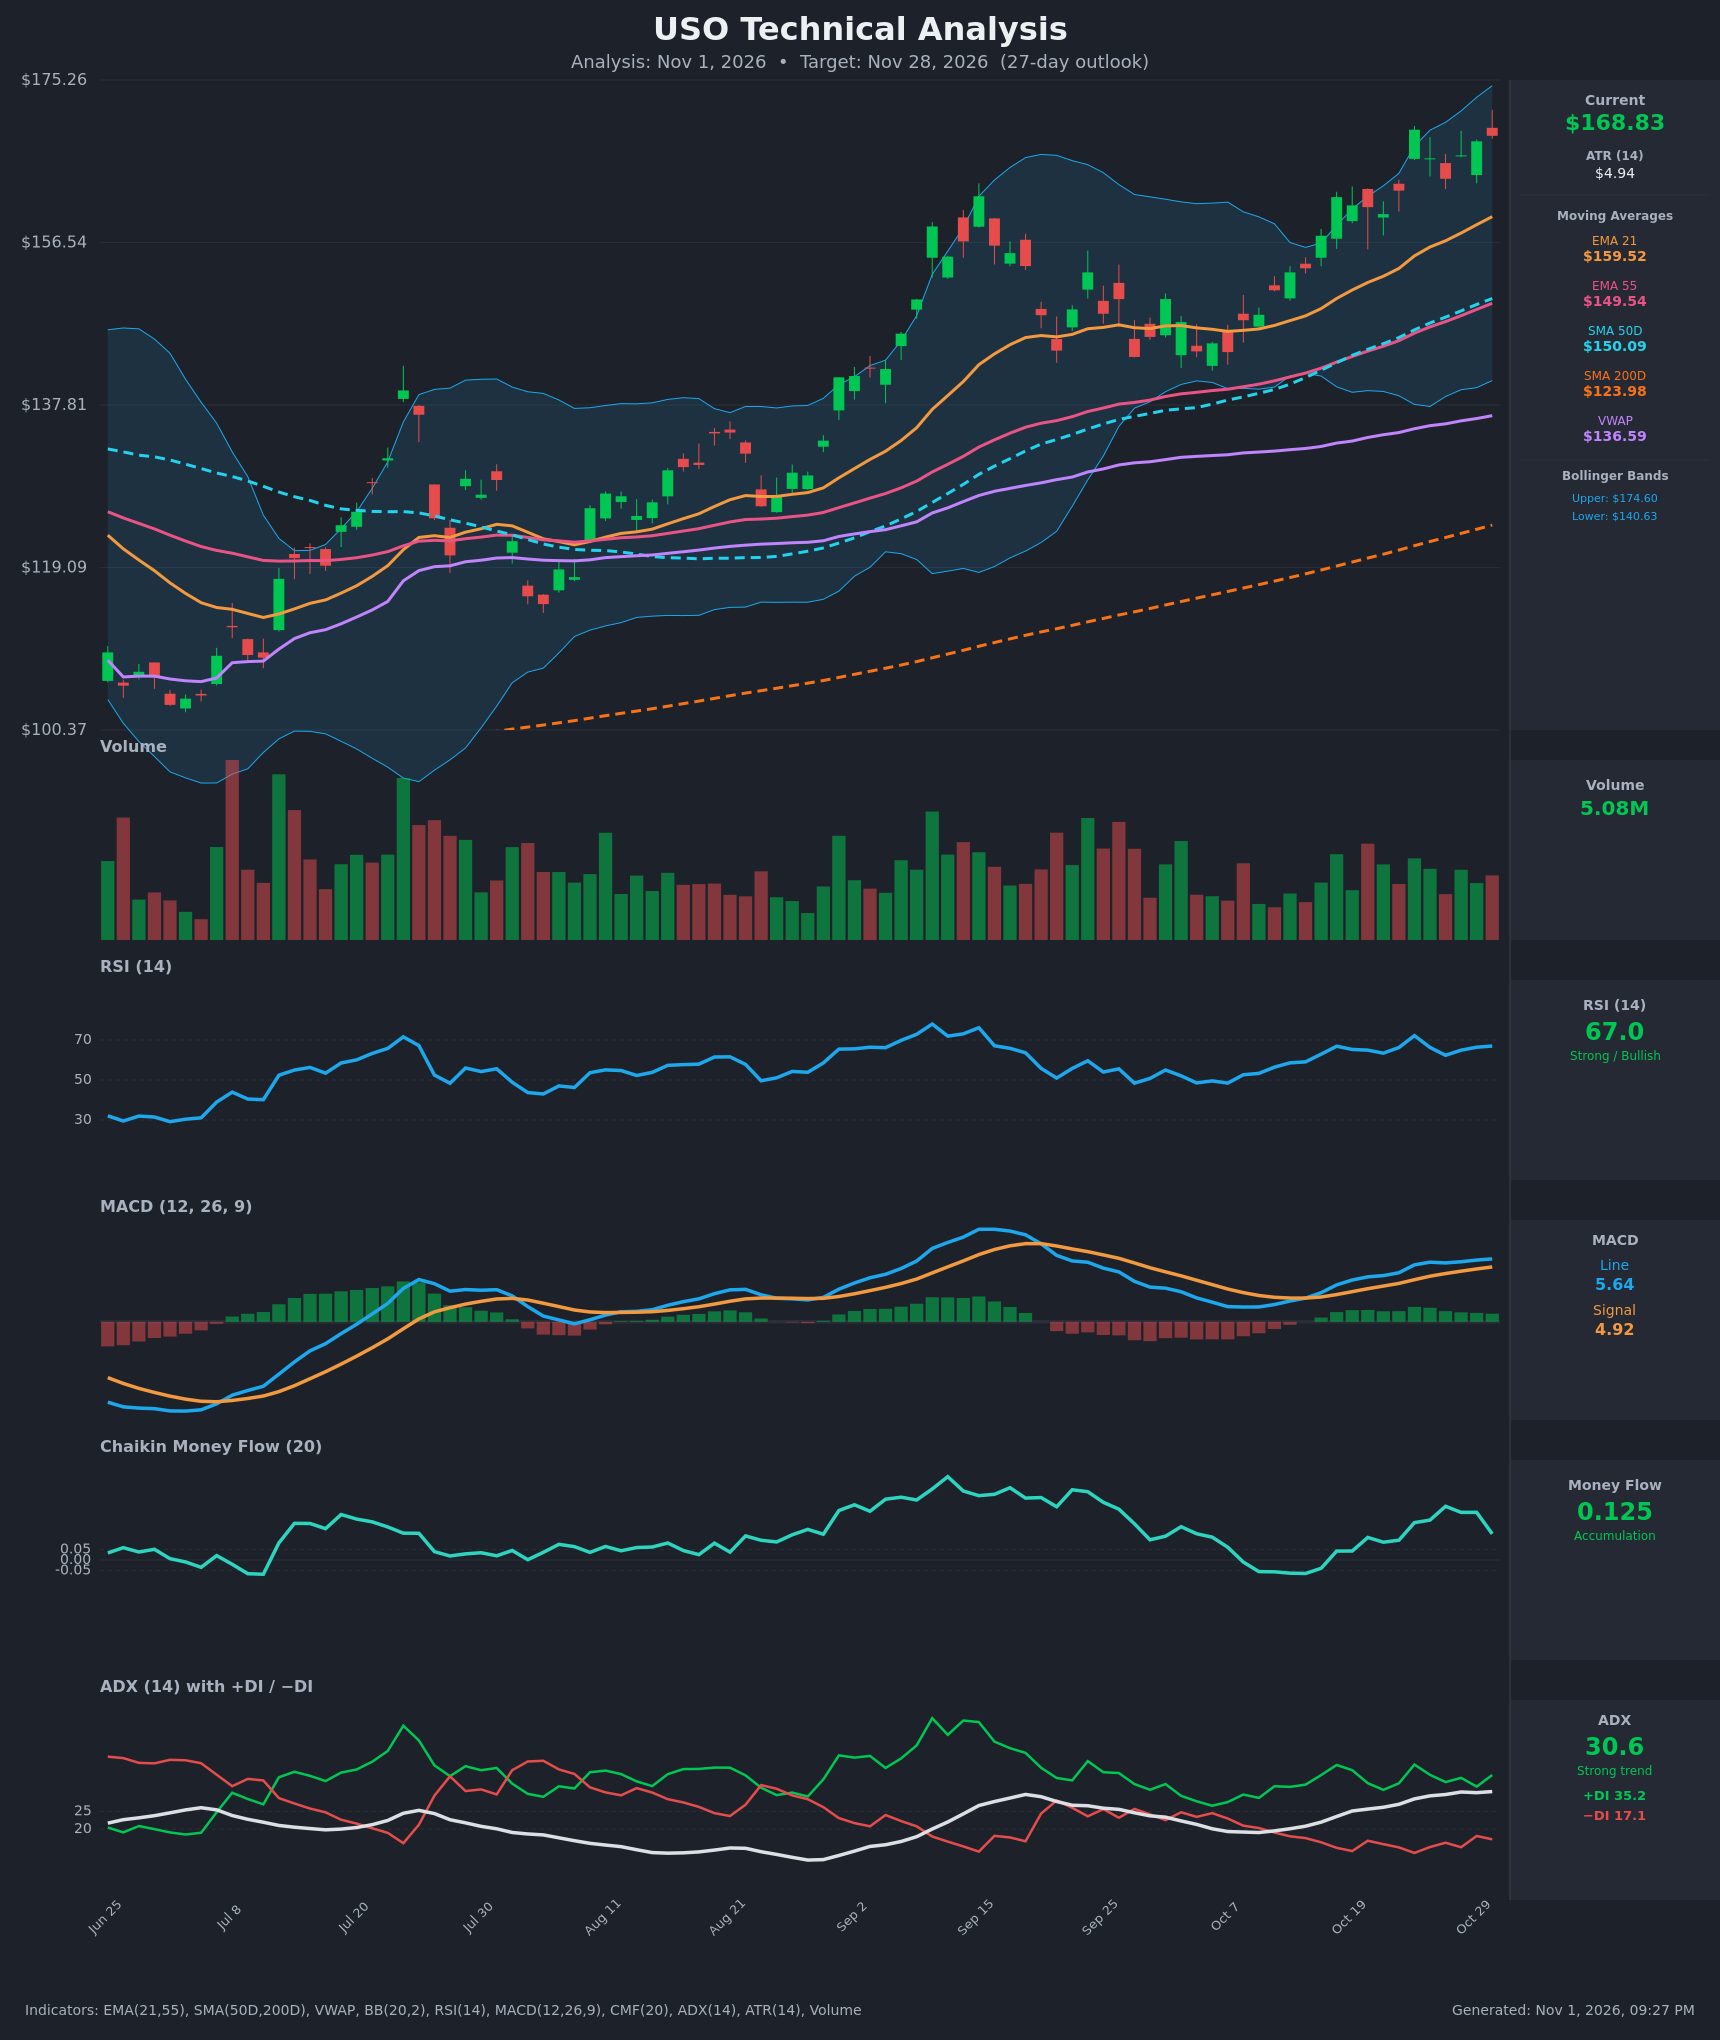
Analysis
TECHNICAL INDICATORS
- RSI (14): 66.98, just under the 70 overbought line. It has held in the 62-67 range for two weeks after a spike to 72.2 on Oct 23. Momentum is strong but not yet stretched. [Bullish]
- 20 EMA (EMA 21 = $159.52): Price at $168.83 is about 5.8% above the EMA 21, which has been rising steadily. EMA 21 is well above EMA 55 ($149.54), so the structure is bullish. The EMA 21 is the first dynamic support on a pullback. [Bullish]
- MACD: Line 5.639 is above signal 4.918, with a positive and widening histogram of about +0.72. The line crossed above the signal around Oct 14-15 and the gap has kept growing. [Bullish]
- Bollinger Bands (20): Upper $174.60, lower $140.63. Price sits in the upper quarter of the bands (about 83% of the band width) and the bands are expanding. That reflects trend strength, not yet an extreme. Price is riding the upper half, with the upper band about $5.8 (3.4%) away. [Bullish]
- CMF (20): 0.125, in accumulation territory (>0.05). It has been positive since Oct 16, but it has slipped from 0.256 (Oct 27) and is rolling over, a mild sign that buying pressure is cooling. [Accumulation]
- ADX (14): 30.6 and rising, with +DI 35.2 over −DI 17.1. That is a strong, established uptrend with bulls clearly in control. [Strong Trend + Bullish]
- Volume: 5.08M, roughly average, with no surge on the recent push to highs. The last candle is a red day with a long upper wick near $172-173, hinting at some intraday rejection. Participation is adequate but not confirming with a climax. [Neutral to mildly cautious]
DIVERGENCES & TRENDS
- No major divergence: Price made a higher high on Oct 23 ($169.53) and again on Oct 30 ($168.83, near that level). RSI at 67 is below its Oct 23 peak of 72.2, which is a mild, minor negative divergence. It is not a confirmed reversal signal.
- CMF: Falling from 0.256 to 0.125 while price holds near highs is a small warning of cooling accumulation.
- MA structure: Price ($168.83) > EMA 21 ($159.52) > SMA 50D ($150.09) ≈ EMA 55 ($149.54) > SMA 200D ($123.98). That is a fully bullish stack. The SMA 50D crossed above the SMA 200D long ago (golden cross, a long-term bullish signal), and price is far above the SMA 200D (+36%) and VWAP ($136.59).
- Trend: ADX has risen from 19.5 to 30.6 as +DI dominates, so trend strength is building. MACD has re-accelerated from a mid-range reset.
- Stretch: Price is about 12.7% above SMA 50D and 36% above SMA 200D, so the move is extended and prone to consolidation or pullbacks to the EMA 21.
CHART PATTERNS
- Primary pattern: A series of higher highs and higher lows from the late-Aug/Sep consolidation. Since late September, price has formed a base around $140-$150 and broken out above the prior Sep high (~$160). This resembles a Bullish Ascending Triangle / continuation breakout (flat resistance around $160-162 broken, with rising lows).
- Alternative: The Sep 15 peak (~$161) followed by a pullback to ~$141 and the new push to $169 looks like a bullish continuation (flag/consolidation breakout). The measured move from the ~$141 low to the ~$161 resistance is about $20, so a breakout target is roughly $181 (from the ~$161 break).
- Risk pattern: The latest candles near $166-$170 with upper wicks could be forming a small double top around $169-$172. A close below ~$163 would raise that risk, and a break below ~$159 (EMA 21) would increase it significantly.
POTENTIAL SCENARIOS
- Scenario 1: Bullish Trend Continuation — Strong ADX, +DI dominance, MACD expansion, and a golden-cross structure keep the uptrend running, with a brief pullback toward the EMA 21 first. Trigger: close above ~$172-$173 (recent wick high) and the upper Bollinger Band at ~$174.60. Target: $178-$184 (pattern-measured move near $181). Invalidation: daily close below $159.50 (EMA 21). (50% probability)
- Scenario 2: Neutral/Choppy Consolidation — Price digests the rapid gain in a $160-$175 range while the EMA 21 catches up. RSI resets to 50-60. Trigger: failure to clear ~$172 with CMF drifting toward 0.05. Target: $160-$172 range. Invalidation: close above $175 or below $158. (28% probability)
- Scenario 3: Bearish Pullback/Double-Top Reversal — Price fails at the $169-$172 area (upper wicks, falling CMF, RSI divergence) and reverts to the mean, targeting the EMA 21 and beyond. Trigger: close below ~$163, then $159.50. Target: $150-$155 (SMA 50D/EMA 55 zone). Invalidation: close above $173. (22% probability)
PRICE TARGETS
For a 27-day timeframe, the range should be about 12-18% of price, so roughly $20-$30 wide. ATR is $4.94, and the √27 scaling of daily ATR gives about ±$25.
- Target Price: $172.50 (27 days)
- Expected Range: $154.00 to $182.00 (width $28.00 = about 16.6% of $168.83, in line with the 12-18% guidance)
- Key Levels: Support at $159.52 (EMA 21), Resistance at $174.60 (upper Bollinger Band)
OVERALL BIAS
OVERALL BIAS: BULLISH - A strong trend (ADX 30.6, +DI 35.2 vs −DI 17.1), a fully bullish MA stack with price far above the SMA 200D, a positive MACD with an expanding histogram, and CMF accumulation outweigh the mild RSI/CMF cooling. Pullbacks toward $159.50 are likely buying opportunities as long as the EMA 21 holds.
This is educational analysis and not financial advice.