META 34-day bearish forecast — Nov 1, 2026
- Bias: Bearish
- Timeframe: 34 days (made Nov 1, 2026, target date Dec 4, 2026)
- Price at analysis: $614.99
- Price target: $588.00
- Expected range: $535.00 – $651.00
- Result: Pending — graded after the close on Dec 4, 2026
Get a free AI analysis of META today
Analysis
TECHNICAL INDICATORS
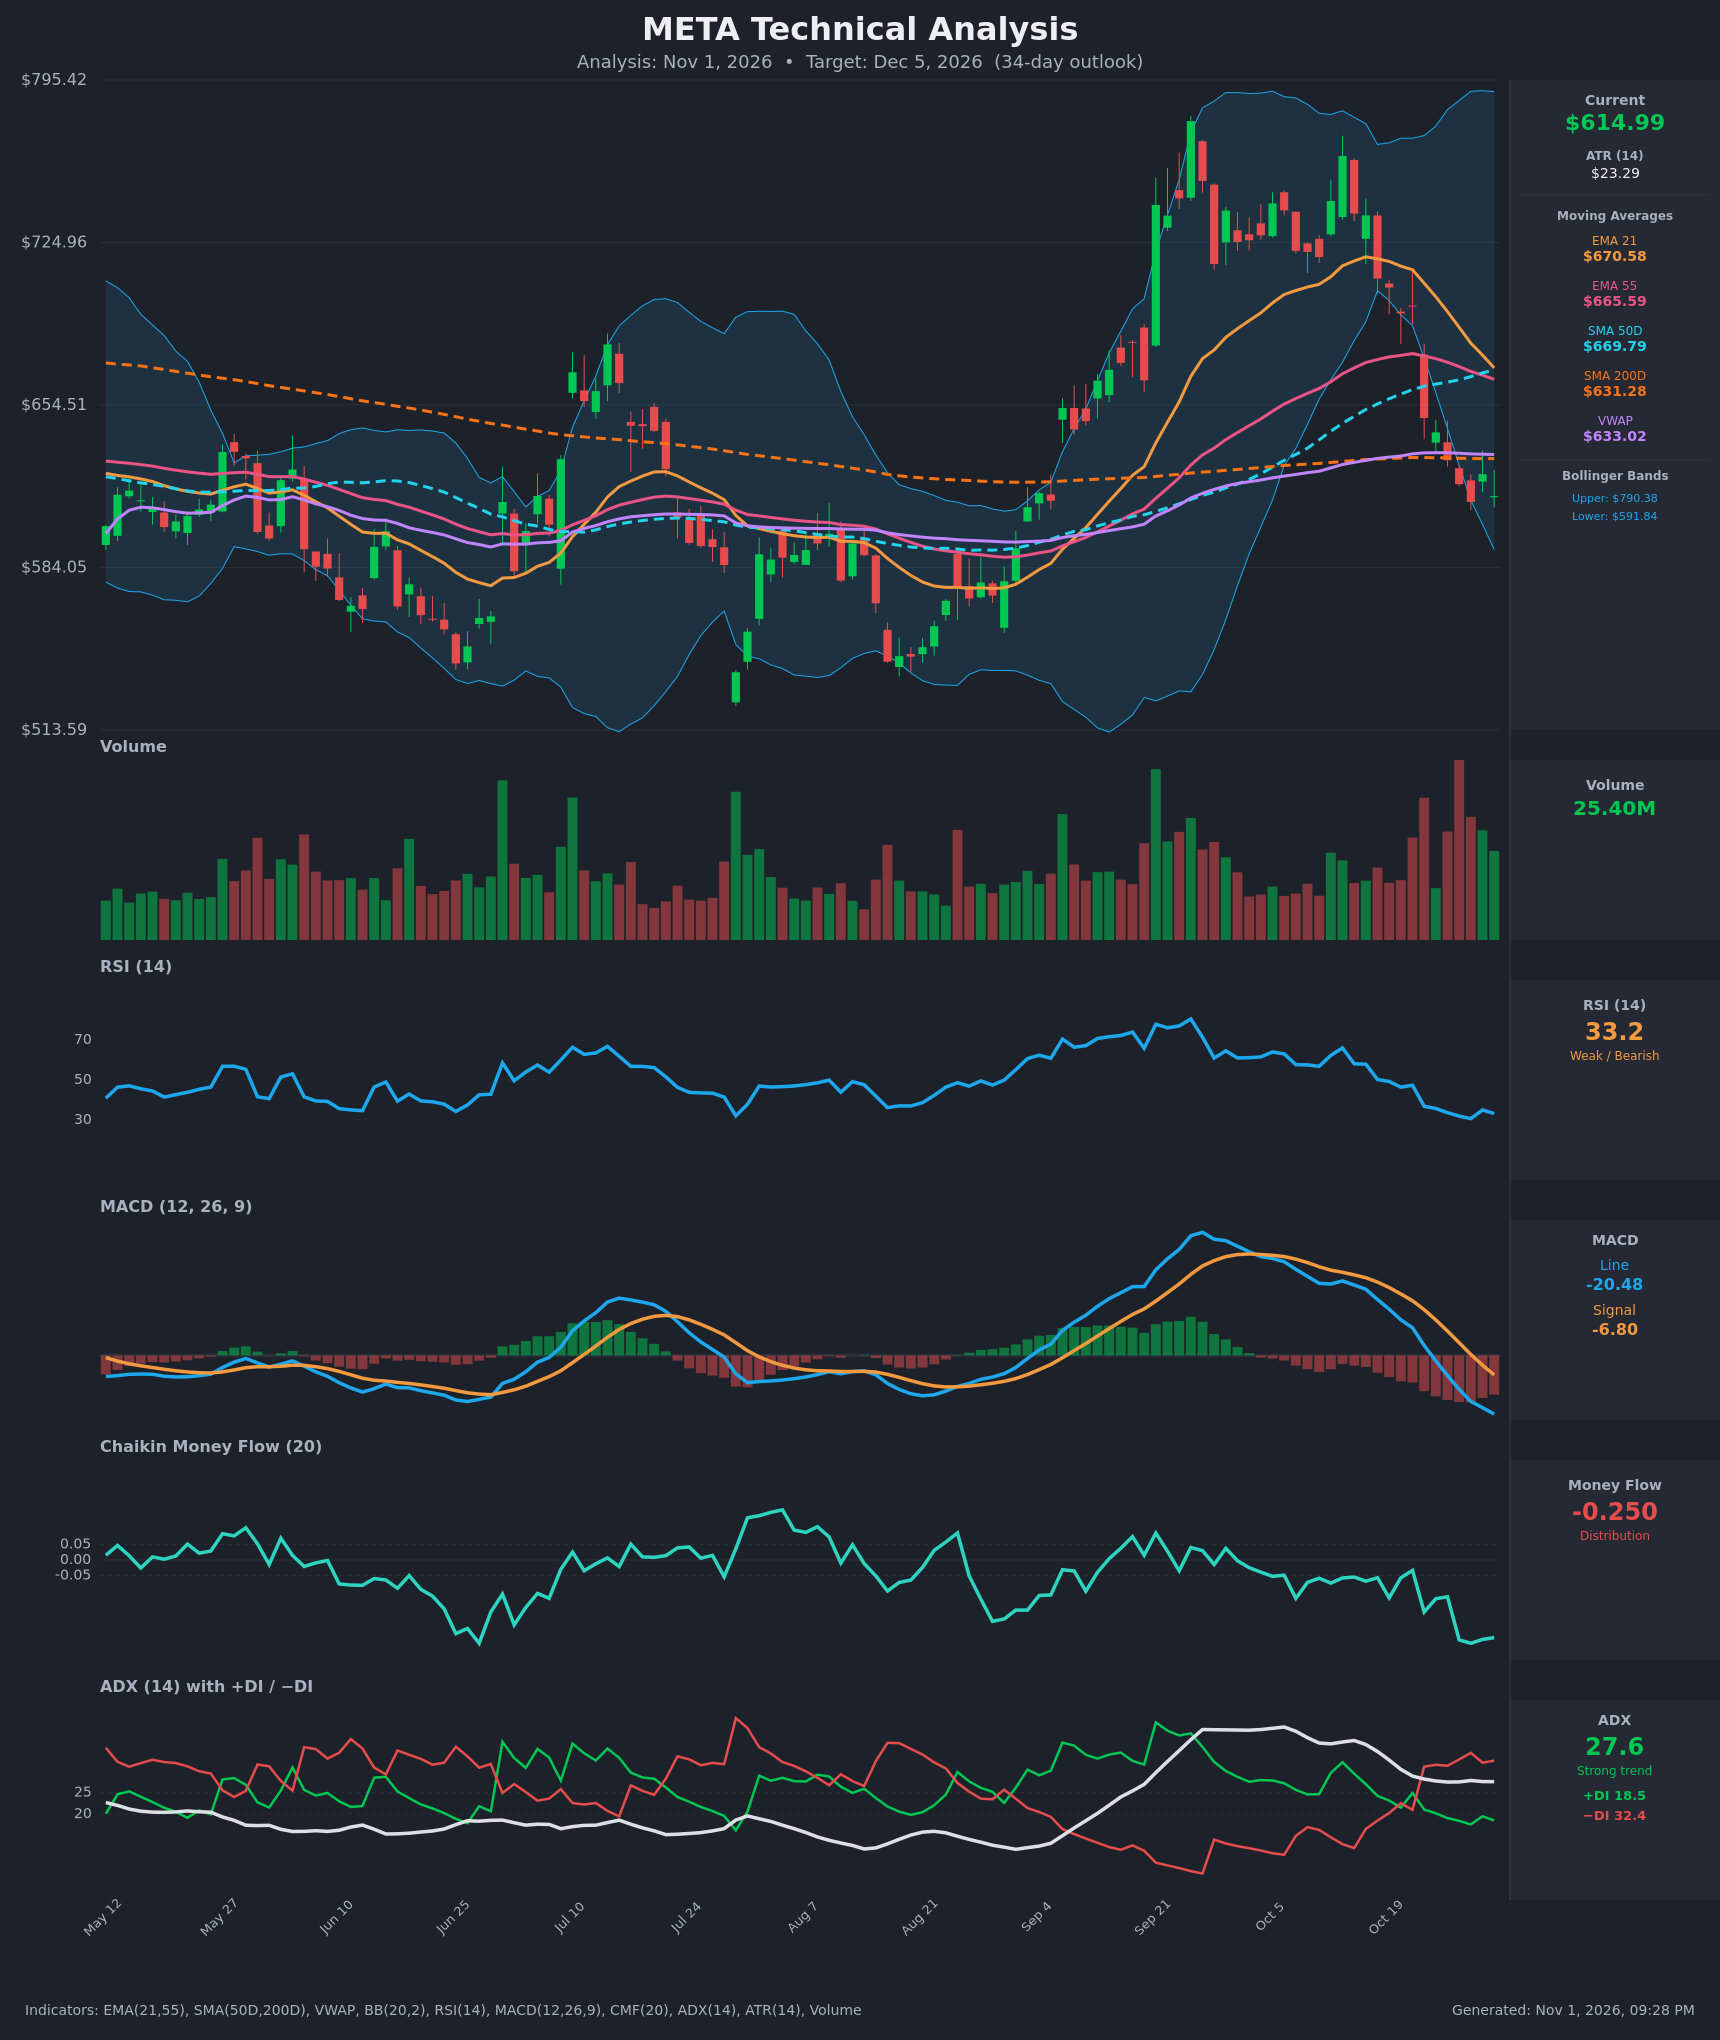
- RSI (14): 33.23, just above the 30 oversold line after bottoming near 30.7 on Oct 28. It fell from 66 on Oct 13 to the low 30s, and the small bounce to 35 on Oct 29 failed. Momentum is bearish but stretched. [Bearish]
- 20 EMA (EMA 21): $670.58. Price at $614.99 sits about 8% below it, and the EMA is sloping down sharply from $718. It acts as overhead resistance. [Bearish]
- MACD: Line -20.48 is below signal -6.80, with a bearish crossover on Oct 23 that is still widening. The histogram is increasingly negative (about -13.7) and the line is accelerating below zero. [Bearish]
- Bollinger Bands (20): Upper $790.38, lower $591.84. Price is in the lower third and about $23 above the lower band, after a "walk" down from the upper half. The bands are very wide, reflecting high volatility. A touch of the lower band is plausible, but no squeeze or reversal signal is present. [Bearish]
- CMF (20): -0.250, well below -0.05. It has been negative throughout the decline and fell from about -0.06 to -0.25 in recent sessions, which shows heavy distribution. [Distribution]
- ADX (14): 27.6, a strong trend. −DI (32.4) is above +DI (18.5), and the DI cross occurred on Oct 22, so bears are in control. ADX has been drifting lower from 37 but remains above 25. [Strong Trend – Bearish]
- Volume: 25.40M, with elevated volume on the down days in mid-to-late October. This confirms selling pressure, and the last few green bars show only a tentative response from buyers. [Bearish – selling pressure confirmed]
Other moving averages: price is below VWAP ($633.02), below SMA50D ($669.79) and below SMA200D ($631.28). EMA21 is crossing down through EMA55 ($665.59), and the gap is only about $5. SMA50D is above SMA200D, so there is no death cross yet, but the 50D is flattening and rolling over. The $631–633 cluster (SMA200D plus VWAP) is now the first resistance.
DIVERGENCES & TRENDS
- No bullish RSI divergence yet. RSI made its low (30.7) when price was at $612, and the later bounce failed, so momentum and price are confirming each other.
- MACD is accelerating downward, with the line at a new low each day, so the trend is not exhausted.
- RSI has been falling since the Oct 13 high, and a drop from 66 to 33 in about 13 sessions is a fast shift.
- The EMA21 has crossed below SMA50D and is about to cross below EMA55 (gap ~$5), which is an imminent bearish crossover.
- Price lost the SMA200D ($631) on Oct 26 and has failed to reclaim it, flipping long-term support into resistance.
- The −DI/+DI cross is bearish, and ADX at 27.6 confirms a real trend, not noise.
- CMF at -0.25 is the weakest reading of the recent swing and is not showing any accumulation.
CHART PATTERNS
- The September peak near $770 and the lower high in October (~$760 area) followed by a steep drop resemble a Bearish Double Top (reversal). The neckline is the early-to-mid September breakdown zone, around $630–650. Price has broken below it. The measured move from the ~$770 peak to ~$640 is about $130, which projects to roughly $500–510.
- The choppy May–Aug range between roughly $550 and $660 provides major structural support. The August low at ~$540–550 is a key demand zone.
- A Bearish Pennant or Flag is not clearly formed, so the move looks more like an impulsive breakdown.
- The reference diagram's targets suggest an extended move lower, but with RSI near 30 a relief bounce toward $631–650 is likely before the next leg.
POTENTIAL SCENARIOS
- Scenario 1: Bearish Continuation Toward the Summer Range — The Double Top breakdown continues. Price rallies weakly to the $631–$640 resistance (SMA200D/VWAP), fails, and then drifts toward the lower Bollinger Band and the $560–$580 demand zone. Trigger: a daily close below $591 (lower BB) or a rejection at $631–$640. Target: $565–$580. Invalidation: a daily close above $670 (EMA21/SMA50D). (50% probability)
- Scenario 2: Neutral/Bullish Oversold Bounce and Range — RSI at ~33 and price near the lower band trigger a mean-reversion bounce back to the $631–$660 cluster, then price chops. Trigger: a close above $633 (VWAP/SMA200D) with CMF turning up. Target: $640–$660. Invalidation: a close below $591. (30% probability)
- Scenario 3: Bearish Capitulation Extension — A sharp breakdown below $591 with volume expansion drives price to the August lows and the Double Top measured move. Trigger: a break of $585 on heavy volume. Target: $510–$540. Invalidation: a reclaim of $631. (20% probability)
PRICE TARGETS
For the 34-day horizon (to Dec 5, 2026), the range width should be about 12–18% of the current price. The width here is $116 / $614.99 = ~18.9%. That is slightly above the guide, but it is justified by an ATR of $23 (about 3.8% daily) and the wide Bollinger Bands.
- Target Price: $588.00
- Expected Range: $535.00 to $651.00
- Key Levels: Support at $591.84 (lower Bollinger Band; next at $560), Resistance at $633.02 (VWAP/SMA200D zone)
OVERALL BIAS
OVERALL BIAS: BEARISH - Price is below all key moving averages (EMA21, EMA55, SMA50D, SMA200D, VWAP) with a bearish MACD crossover, −DI dominating at ADX 27.6, and CMF at -0.25 showing heavy distribution. The oversold RSI argues for a bounce toward $631–$650 first, but the bounce is likely to meet resistance, and the Double Top structure favors lower prices.
This is educational analysis and not financial advice.