INTC 34-day bearish forecast — Nov 1, 2026
- Bias: Bearish
- Timeframe: 34 days (made Nov 1, 2026, target date Dec 4, 2026)
- Price at analysis: $65.76
- Price target: $61.50
- Expected range: $57.00 – $68.50
- Result: Pending — graded after the close on Dec 4, 2026
Get a free AI analysis of INTC today
Analysis
TECHNICAL INDICATORS
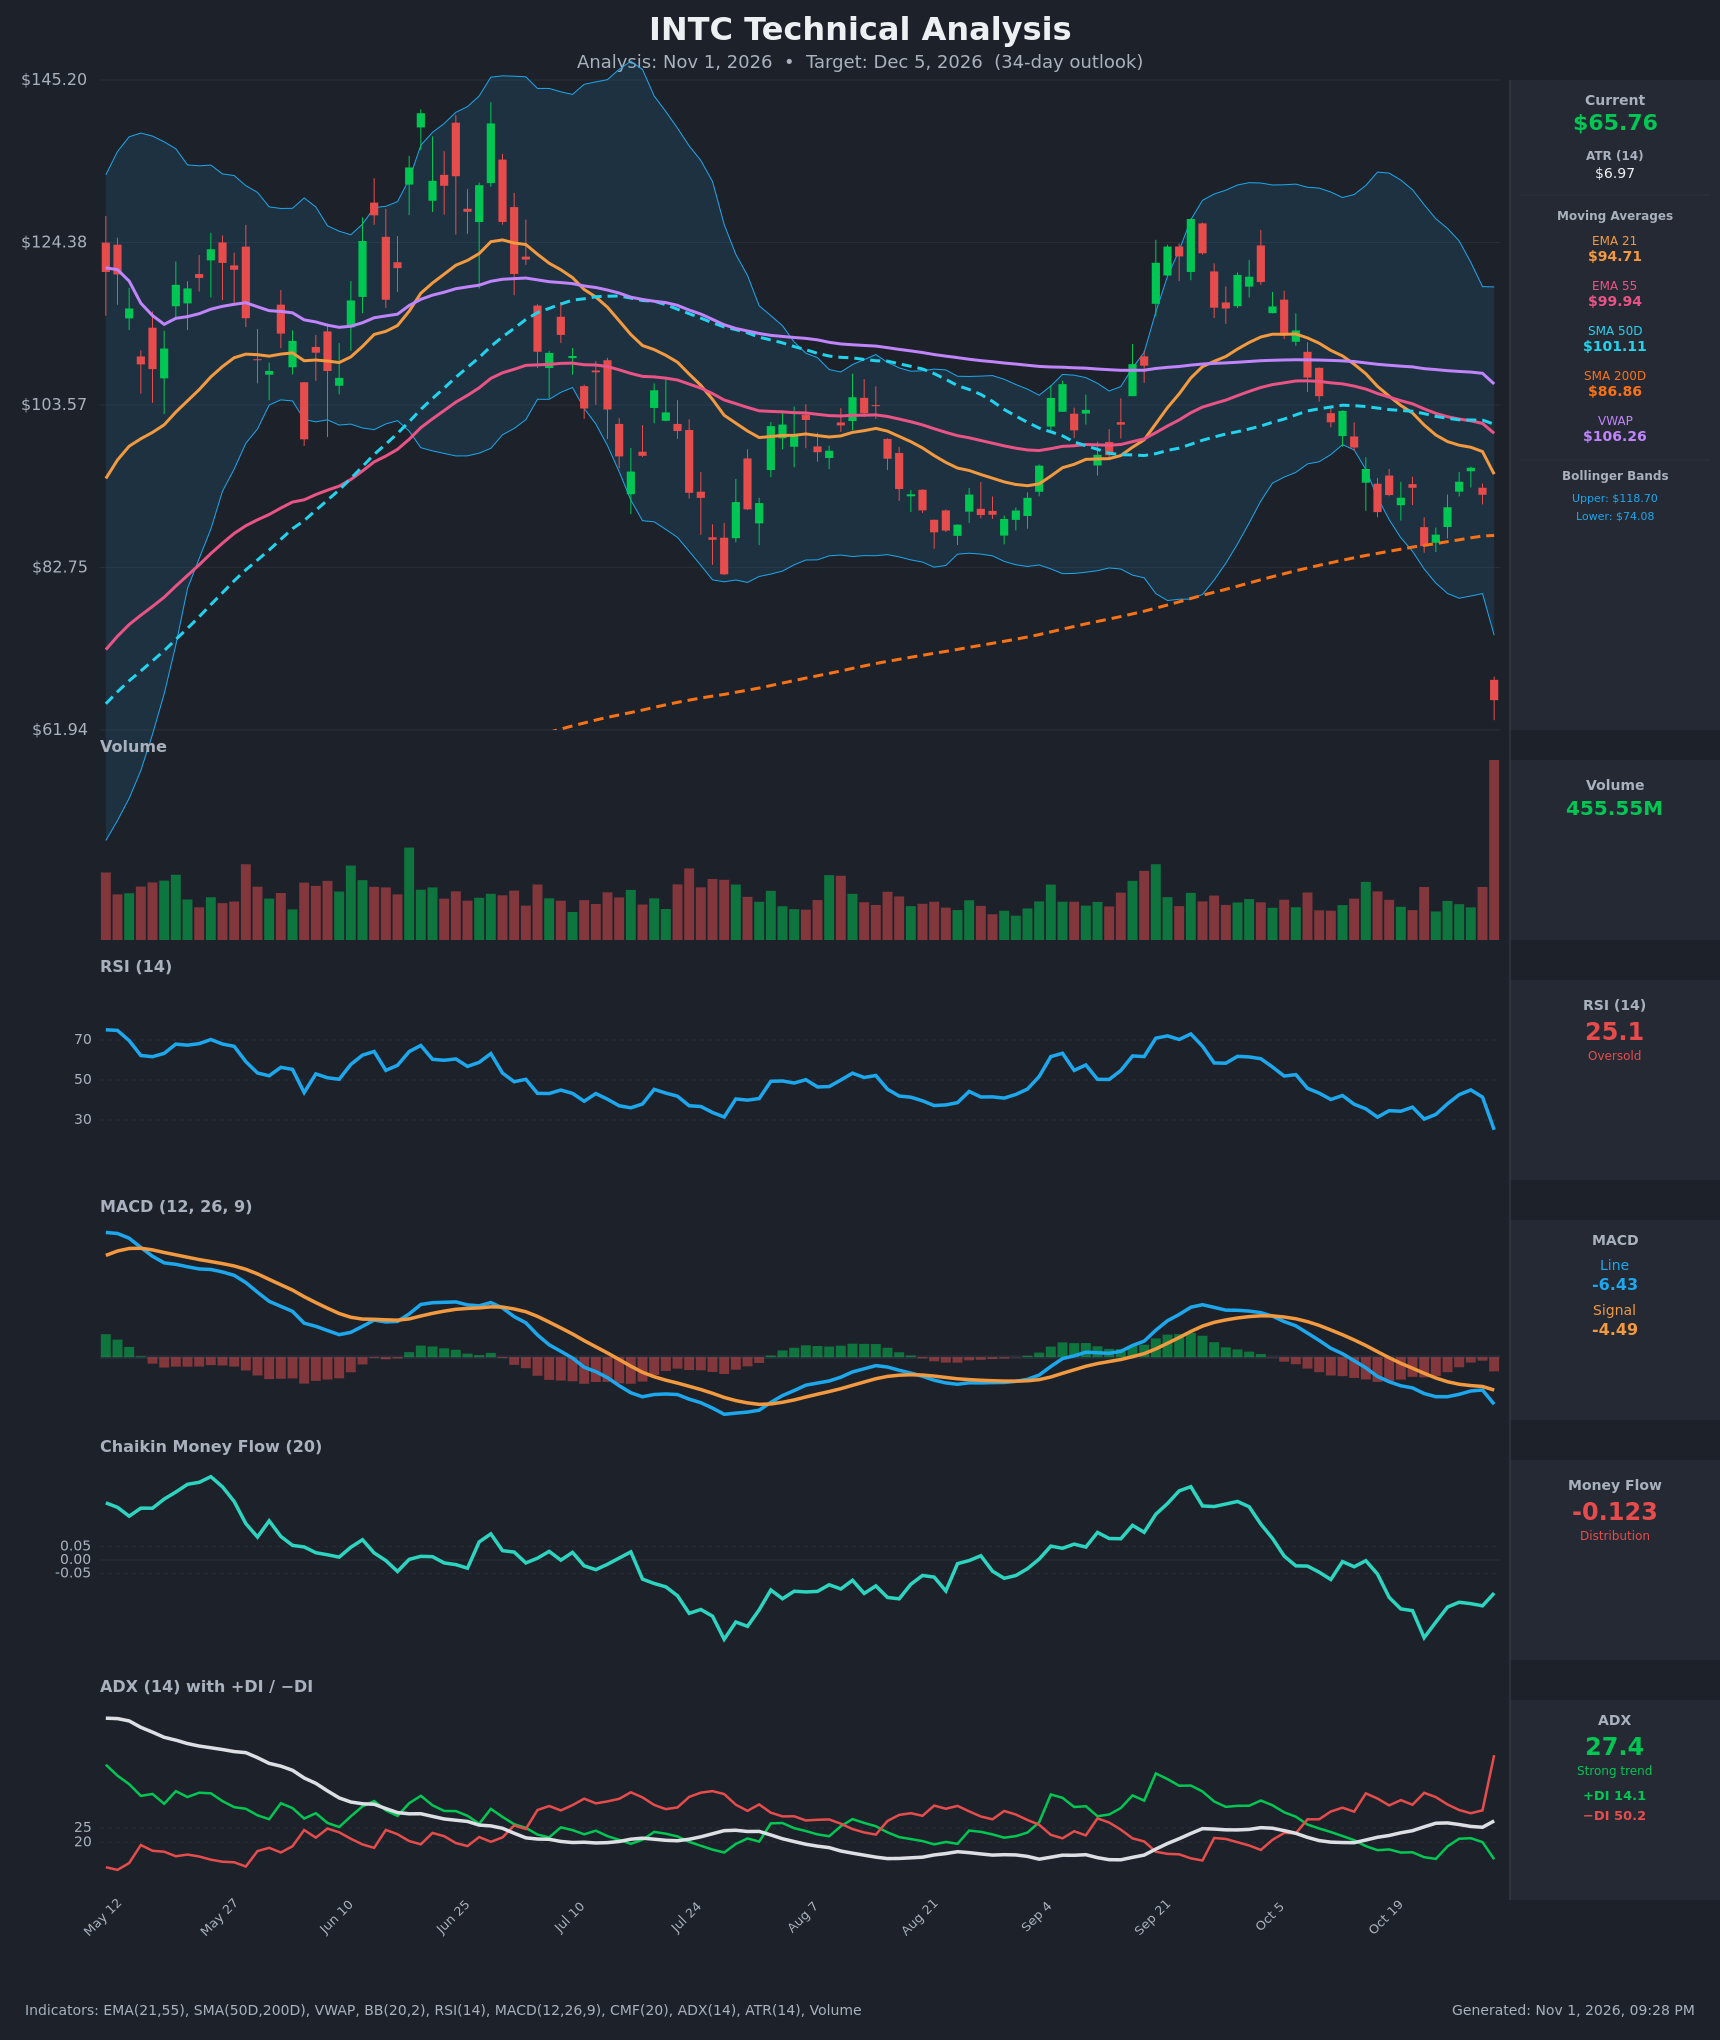
- RSI (14): 25.10, deeply oversold after plunging from 41.5 in a single session. Momentum is sharply negative, though the reading raises the odds of a relief bounce. [Bearish]
- 20 EMA (EMA 21): $94.71. Price at $65.76 is about 30% below it, so the EMA is distant overhead resistance. EMA21 crossed below EMA55 ($99.94) around Oct 20 and the gap is widening. [Bearish]
- MACD: Line -6.43 is below signal -4.49 (bearish crossover since Oct 19). The histogram is negative and expanding, and the line is making new lows for the visible period. [Bearish]
- Bollinger Bands (20): Price is well below the lower band ($74.08), roughly $8 outside it. The upper band is $118.70, so the bands are very wide. A close this far outside the band shows an extreme, volatility-driven move. It can precede a bounce, but it often leads to "walking the band" after a gap. [Bearish]
- CMF (20): -0.123, below the -0.05 threshold. It was already weak (-0.17 to -0.19) before the gap, and the gap-down session adds distribution. [Distribution]
- ADX (14): 27.4 and rising, above the 25 trend threshold. −DI is 50.2 versus +DI 14.1, a very wide gap with bears firmly in control. [Strong Trend – Bearish]
- Volume: 455.55M, by far the largest bar on the chart, on a red candle. This is a heavy-volume breakdown and potential capitulation or news-driven event. It confirms the move's significance, but it does not yet show a reversal. [Bearish / Capitulation Risk]
DIVERGENCES & TRENDS
- There is no bullish RSI or MACD divergence. Both indicators made new lows with price, so they confirm the decline.
- RSI fell from 41.5 to 25.1 in one bar. This is the lowest reading in the visible window and is below the prior ~30 floor (Jul and Oct).
- Price lost the SMA200D ($86.86), a major long-term support that held through the Oct 22 low ($85.49). It is now about 24% below it.
- SMA50D ($101.11) remains above SMA200D, so there is no death cross yet. The slope of SMA50D has turned down, and one could form in the coming weeks.
- Price is below VWAP ($106.26), EMA21, EMA55 and both SMAs. All moving averages are overhead resistance.
- ADX and −DI are accelerating, while +DI has collapsed to 14.1.
- The unfilled gap between about $92 and $66 is a key reference, because gaps like this often get partly retraced.
CHART PATTERNS
- Bearish Flag / Descending range breakdown: Price fell from the Oct highs, then formed a weak consolidation and rebound from $85.49 to $95.53. It then gapped down through the SMA200D and the lower Bollinger Band. This resembles the continuation-style breakdown in the reference diagram, but the gap makes it a news-driven breakdown rather than a clean measured pattern.
- No reliable reversal pattern (double bottom, inverted H&S) has formed. A bounce from here would more likely be a dead-cat bounce, with $74–$78 as the first resistance zone.
- Measured-move reference: the prior leg from about $95 to $66 is about $29. Extending it from any bounce would point toward the high-$50s to low-$60s, but a lower probability of full extension is likely after such a large one-day move.
POTENTIAL SCENARIOS
- Scenario 1: Bearish Post-Gap Continuation — Heavy distribution, −DI dominance and a rising ADX keep selling pressure alive after the gap. Price makes lower highs below $74, retests the day's low, and drifts below it. Trigger: failure to reclaim $70–$74 or a daily close below $62. Target: $60–$62, with an extension to $57. Invalidation: daily close above $74.08 (the lower Bollinger Band). (50% probability)
- Scenario 2: Bullish Oversold Relief Bounce — RSI of 25 and a capitulation-volume bar lead to a mean-reversion rally. Price partly retraces the gap toward the lower band and EMA zone. Trigger: close above $70 on rising volume with RSI back above 35. Target: $74–$80. Invalidation: close below $62. (35% probability)
- Scenario 3: Neutral Base Building — Price stabilizes in a $60–$72 range as selling exhausts and buyers cautiously return. Trigger: a series of narrow-range candles holding above $62. Target: $64–$68. Invalidation: close outside $60–$72. (15% probability)
PRICE TARGETS
Range-width check: $68.50 − $57.00 = $11.50, or about 17.5% of $65.76, which is within the 12–18% guidance for a 30–60 day timeframe.
- Target Price: $61.50 (34-day)
- Expected Range: $57.00 to $68.50
- Key Levels: Support at $60.00, Resistance at $74.08
OVERALL BIAS
OVERALL BIAS: BEARISH - A gap-down on record volume through the SMA200D, with −DI at 50.2, ADX rising above 25, negative CMF and a widening MACD bearish spread, favors continued downside drift. The oversold RSI of 25 makes a bounce likely along the way, but it should stall below the $74 lower band.
This is educational analysis and not financial advice.