USO 34-day bullish forecast — Nov 1, 2026
- Bias: Bullish
- Timeframe: 34 days (made Nov 1, 2026, target date Dec 4, 2026)
- Price at analysis: $168.83
- Price target: $173.00
- Expected range: $156.00 – $185.00
- Result: Pending — graded after the close on Dec 4, 2026
Get a free AI analysis of USO today
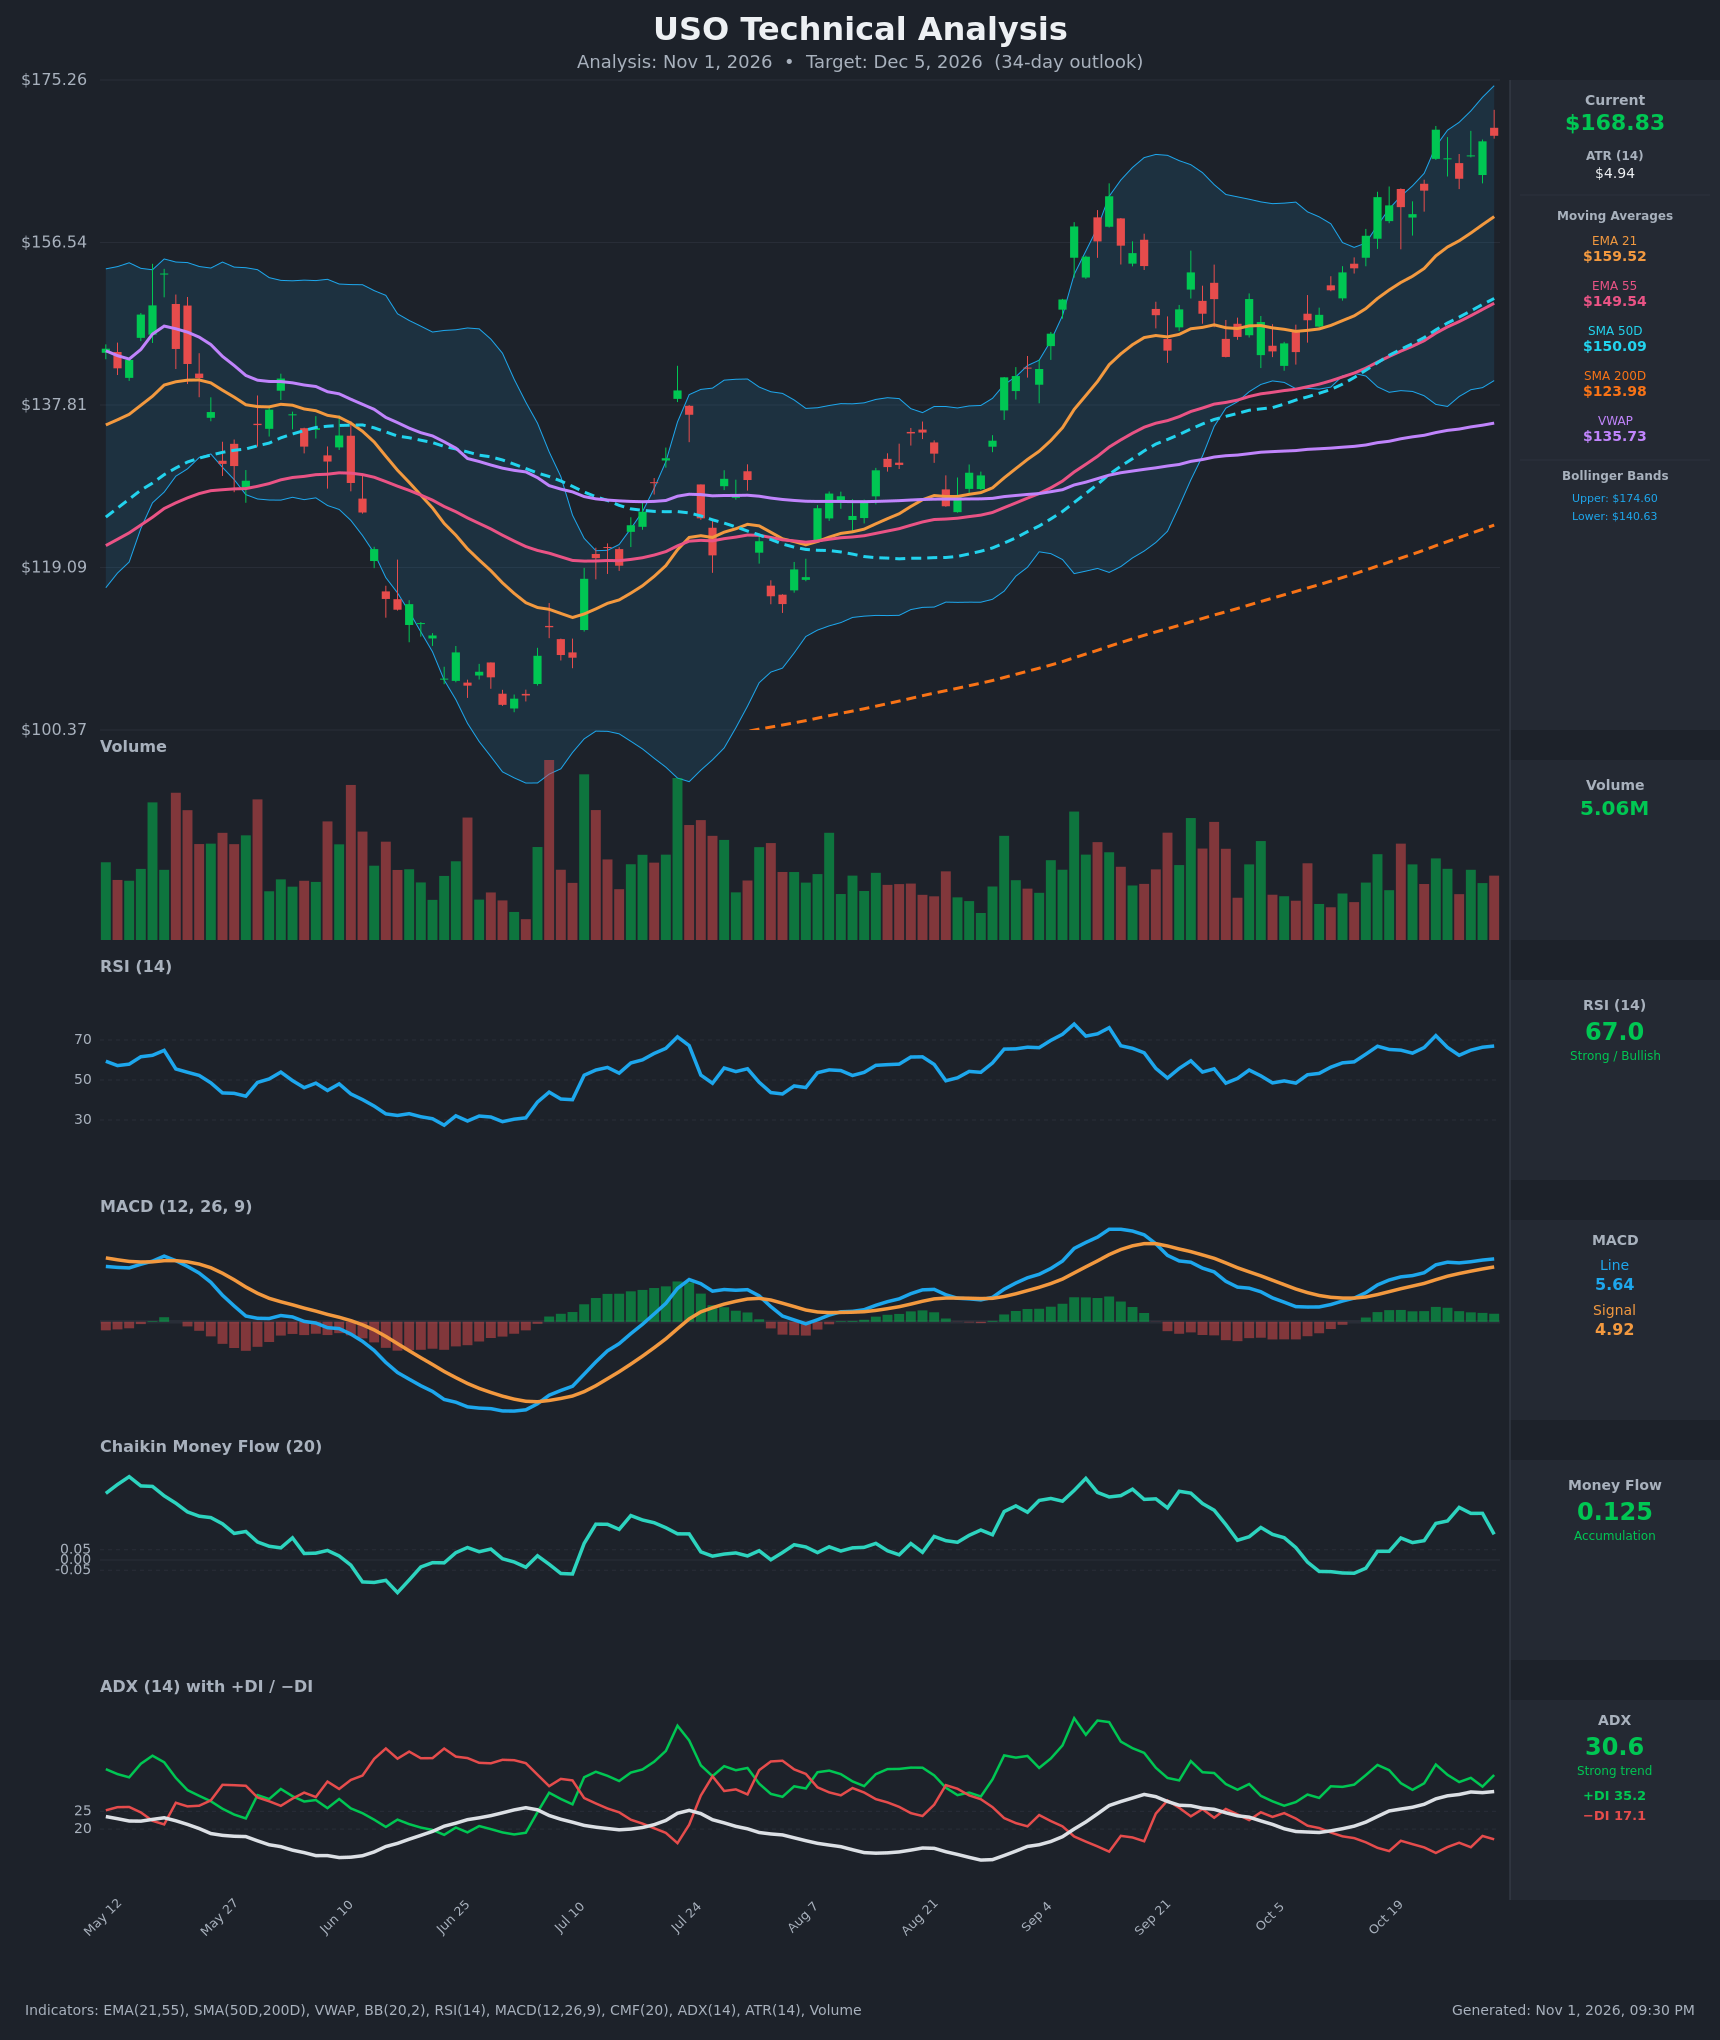
Analysis
TECHNICAL INDICATORS
- RSI (14): 66.98, up from the mid-50s in mid-October and just below the 70 overbought line. It touched 72 on Oct 23 and has held in the mid-60s since. Momentum is strong but not yet stretched. [Bullish]
- 20 EMA (EMA 21): $159.52, rising steeply. Price at $168.83 is about 5.8% above it, so the EMA is dynamic support. EMA21 is above EMA55 ($149.54), and that bullish stack is widening. [Bullish]
- MACD: Line 5.639 is above Signal 4.918, with a positive, slowly expanding histogram (about +0.72). The bullish crossover happened around Oct 14-15 and the gap has widened since. The line is still below its September peak, so momentum is less powerful than on the last leg up. [Bullish]
- Bollinger Bands (20): Upper $174.60, lower $140.63, so the bands are wide. Price is in the upper quarter of the band, about $5.8 below the upper band, and is "walking the band" without a clear breakout. The wide bands reflect a big expansion in volatility. [Bullish]
- CMF (20): 0.125, which is accumulation (above +0.05). It has been positive since Oct 16 but is off the 0.256 peak on Oct 27, so buying pressure is fading slightly. [Accumulation]
- ADX (14): 30.6 and rising from 19.5 on Oct 12, with +DI 35.2 well above −DI 17.1. Bulls are clearly in control of a strong trend. [Strong Trend + Bullish]
- Volume: 5.06M, which is average to below average, and volume has not expanded on the recent push to new highs. The big green volume bars came earlier, during the Sep breakout. Participation is adequate but not confirming. [Neutral to mildly Bearish]
Moving average structure:
- Price is above SMA200D ($123.98), SMA50D ($150.09) and VWAP ($135.73), a classic long-term uptrend.
- SMA50D crossed above SMA200D long ago, so the golden cross is in place.
- SMA50D and EMA55 are converging and rising.
DIVERGENCES & TRENDS
- Mild bearish divergence: Price is at a higher high ($168.83 vs about $162 in early September), but RSI is lower (67 vs about 77) and the MACD line is lower (5.6 vs about 8-9 in September). Momentum is not confirming the new highs.
- CMF is rolling over from 0.256 to 0.125 while price pushes higher, a small warning on accumulation.
- Trend indicators are aligned bullishly. ADX is rising through 25 and then 30, and +DI is dominant. EMA21 and EMA55 are fanning out and the MACD signal-line crossover is intact.
- Price is extended: about 12.5% above SMA50D and about 36% above SMA200D. This raises the odds of a consolidation or pullback toward the EMA21, but it does not break the trend.
- There is no death cross or bearish MACD cross. A pullback is more likely to be a pause in an uptrend than a reversal.
CHART PATTERNS
- Rising channel with a possible Bullish Flag / Ascending Triangle: Since Oct 23, price has been consolidating just under the $169.5 high, making higher lows ($163.9, $166.2) after a sharp run from $151. This resembles an ascending triangle or a bullish flag from the reference diagram. A close above about $170 would target a measured move toward $180-$185 (the Oct 12-23 pole of about $18 added to the breakout).
- Bearish risk (Bearish Rising Wedge / Double Top): The Oct 23 high ($169.53) and the current test form a possible double top with the lower-momentum divergence. A break below the $163-$164 range lows would put $159.50 (EMA21) in play, then $150 (SMA50D/EMA55).
- The September spike high near $162 has become support after the breakout.
POTENTIAL SCENARIOS
- Scenario 1: Bullish Breakout Continuation — Price clears the $169.5-$170 resistance, the flag/ascending-triangle resolves up, and ADX keeps rising. Trigger: daily close above $170.50 on improving volume. Target: $178-$185, with the upper Bollinger Band near $175 as the first hurdle. Invalidation: close below $163. (50% probability)
- Scenario 2: Bearish Pullback to Mean — The momentum divergences and weakening CMF lead to a reversal from the extended level, with a retest of the rising EMA21. Trigger: close below $163.50, then $159.50. Target: $154-$159 (EMA21), with a deeper test of $150 (SMA50D/EMA55). Invalidation: close back above $170. (35% probability)
- Scenario 3: Neutral Consolidation — Price chops between $160 and $174 as the moving averages catch up. Trigger: repeated failures at $170 with support holding at $160. Target: $162-$172. Invalidation: a decisive close outside the $159-$175 range. (15% probability)
PRICE TARGETS
- Target Price: $173.00 (34-day horizon, modest upside given the strong trend, offset by extension and the momentum divergences)
- Expected Range: $156.00 to $185.00 (width $29, about 17.2% of the current price, which fits the 30-60 day guidance of 12-18%)
- Key Levels: Support at $159.50 (EMA21, with $163.00 as nearer minor support), Resistance at $174.60 (upper Bollinger Band, with $170.00 as the near-term lid)
OVERALL BIAS
OVERALL BIAS: BULLISH - Price is above every moving average, with a strong and rising ADX (30.6, +DI far above −DI), positive CMF (0.125), a MACD above its signal line and RSI at 67 with room before 70. The momentum divergences and the extension above the EMA21 argue for conviction that is modest rather than high, and for a pullback along the way.
This is educational analysis and not financial advice.