ASTS 48-day bearish forecast — Nov 1, 2026
- Bias: Bearish
- Timeframe: 48 days (made Nov 1, 2026, target date Dec 18, 2026)
- Price at analysis: $40.97
- Price target: $37.00
- Expected range: $29.50 – $47.00
- Result: Pending — graded after the close on Dec 18, 2026
Get a free AI analysis of ASTS today
Analysis
TECHNICAL INDICATORS
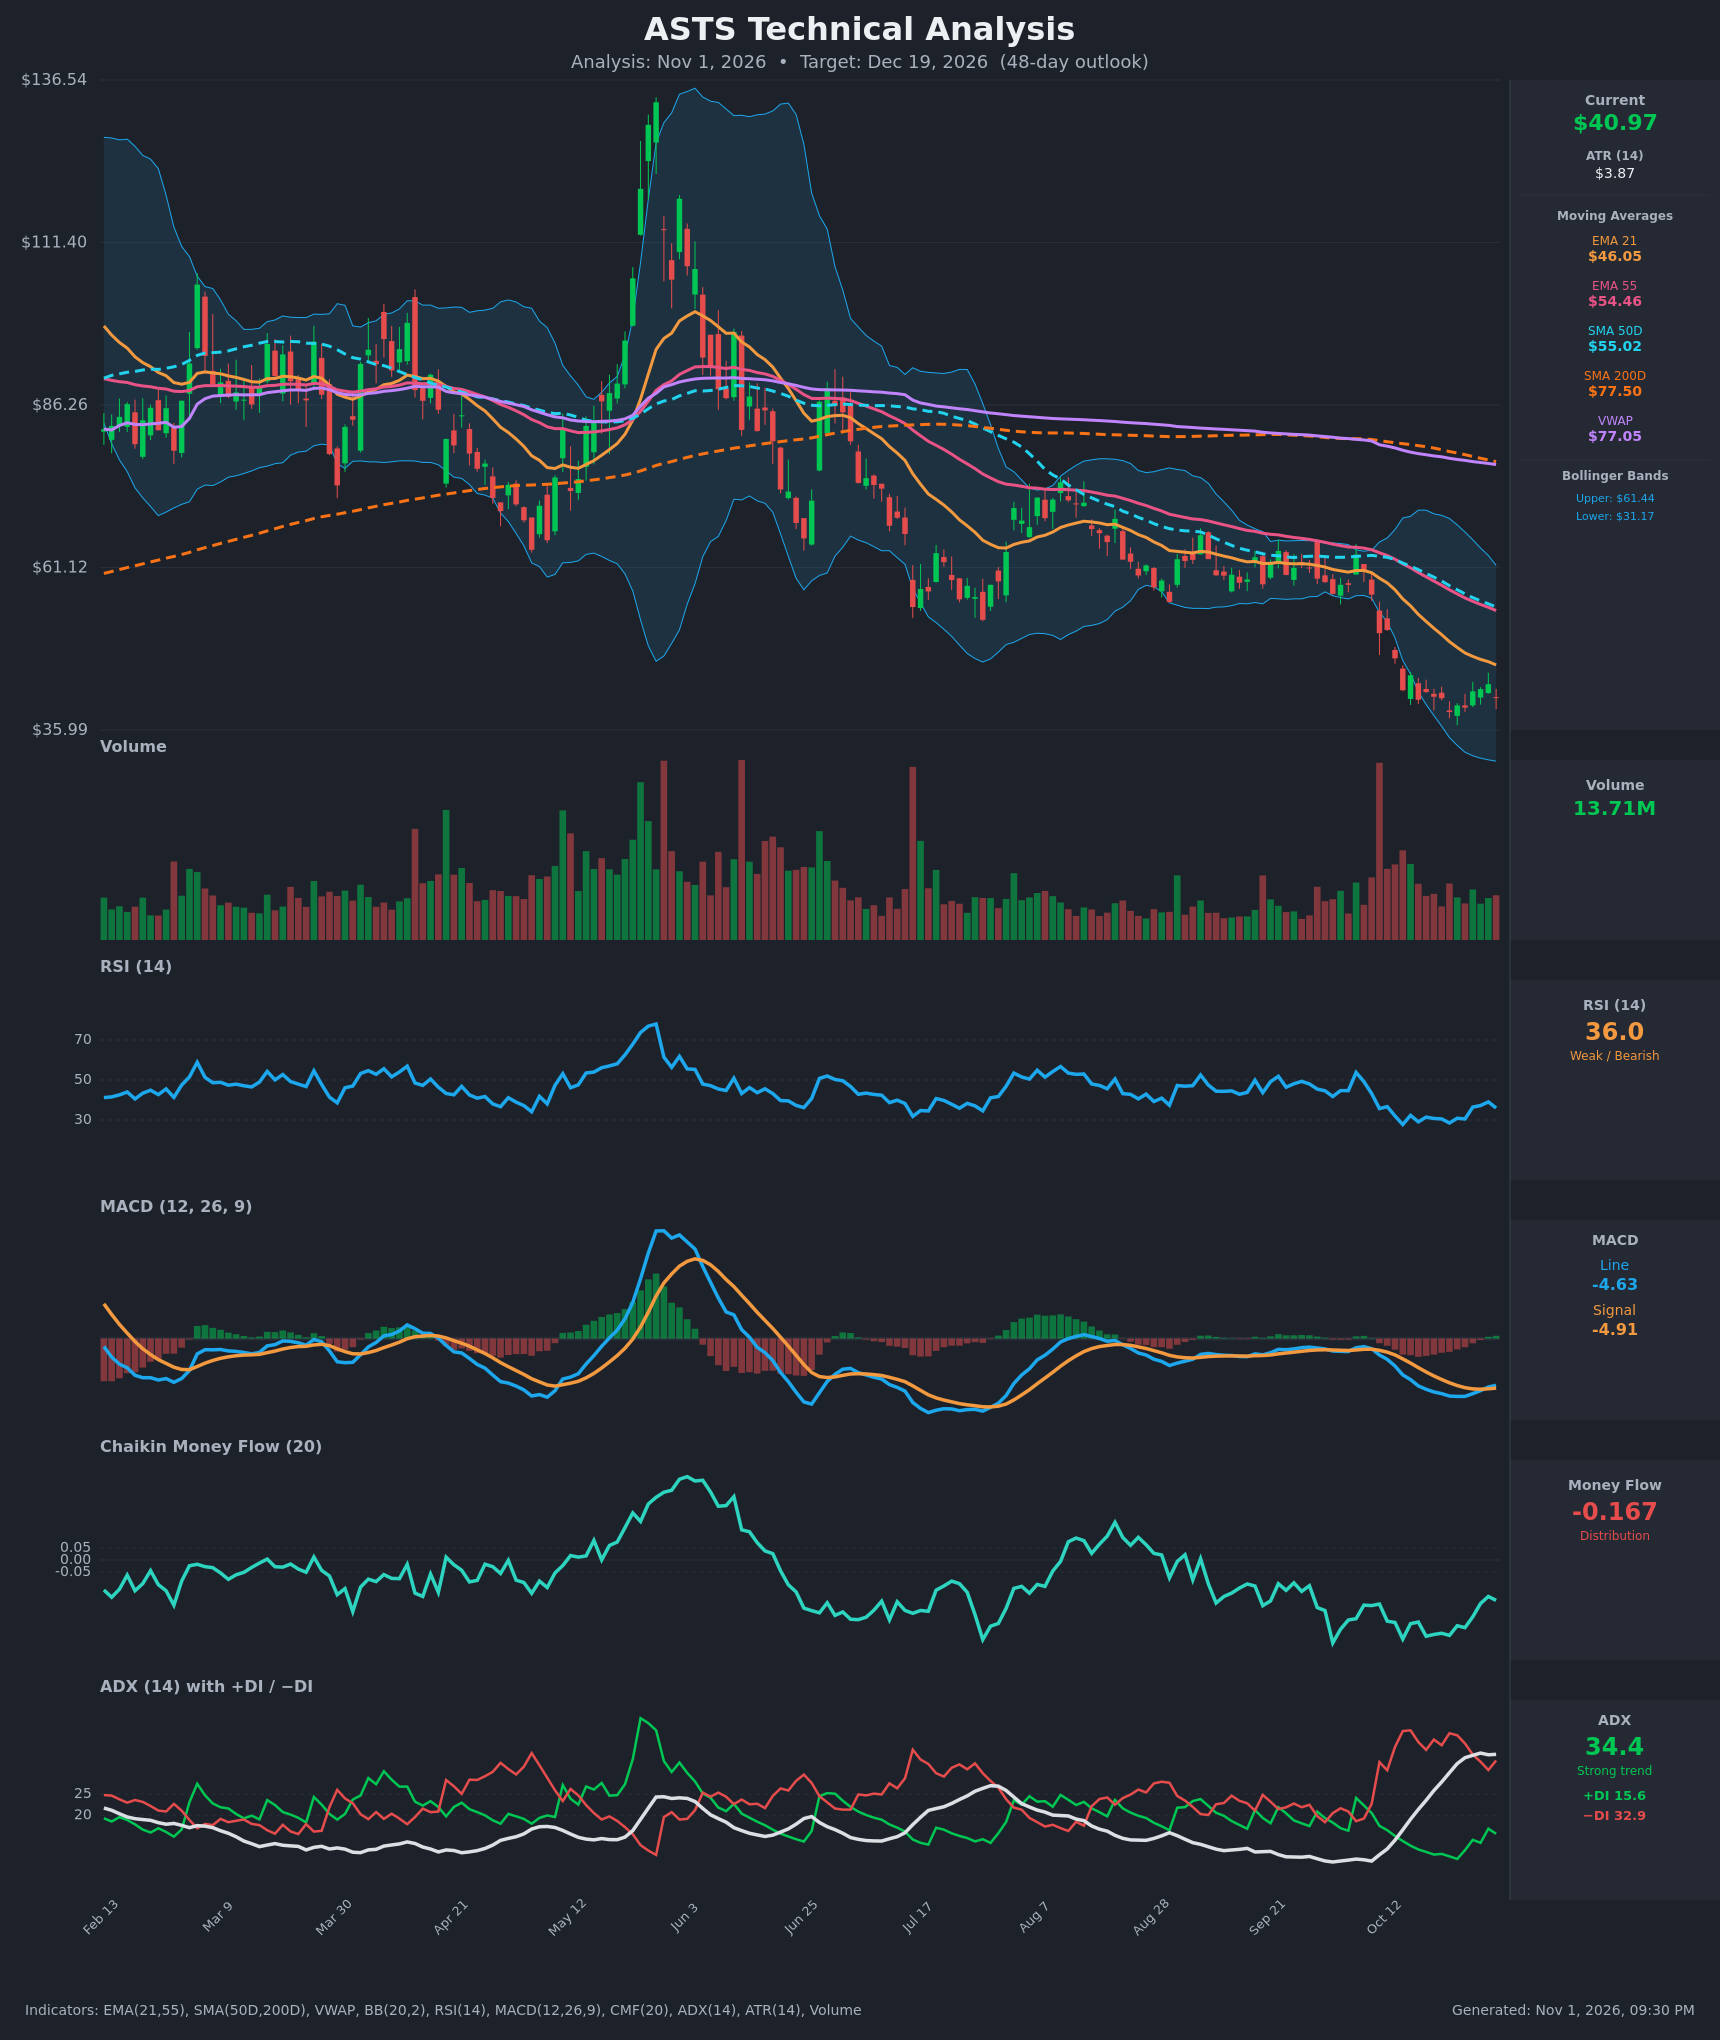
- RSI (14): 35.98, below 50 and near oversold territory. It bounced from about 28-29 in late October, with a high of 39 on Oct 29, and has now rolled over to 36. There is no deep oversold reading or clear reversal yet. [Bearish]
- 20 EMA: The 21 EMA is $46.05, falling steeply from $58.74 on Oct 12. Price at $40.97 is about 11% below it, so the EMA acts as overhead resistance. The 21 EMA is below the 55 EMA ($54.46), a bearish stack. [Bearish]
- MACD: Line -4.63, signal -4.91, so the line sits slightly above the signal. The histogram is marginally positive at about +0.27 and has turned up from its low. This is a nascent bullish crossover, but it is occurring deep below zero, so it signals only a slowing of downside momentum, not a reversal. [Neutral]
- Bollinger Bands (20): Upper $61.44, lower $31.17, middle about $46.3, which matches the 21 EMA. Price is in the lower half, about 33% of the way from the lower band to the upper band. Bands are wide, which reflects high volatility. Price hugged the lower band in late October and has bounced off it. A walk down the lower band implies a persistent downtrend. [Bearish]
- CMF (20): -0.167, well below -0.05, so distribution persists. It has improved from -0.31 in mid-October to -0.15 and is now ticking back down, so selling pressure is easing but not reversed. [Distribution]
- ADX (14): 34.4 and rising, with −DI (32.9) far above +DI (15.6). This is a strong downtrend. ADX has been rising since the Oct 12 reading of 12, which confirms trend strength. +DI has bounced from 9.7 but remains well under −DI. [Strong Trend - Bearish]
- Volume: 13.71M, near average, with no capitulation spike on the latest bars. The large volume spike on the breakdown in mid-October came on the sell-off, and the small bounces show only average participation. There is no climactic bottoming volume yet. [Neutral to Bearish - no capitulation evidence]
DIVERGENCES & TRENDS
- Long-term structure: Price is far below the SMA200D ($77.50), SMA50D ($55.02), and VWAP ($77.05). The SMA50D crossed below the SMA200D earlier in the year (a death cross, with the 50D now about $22 below the 200D). All the moving averages are falling.
- Moving average stack: Price < EMA21 < EMA55 < SMA50D < SMA200D. This is a fully bearish alignment.
- Mild bullish divergence: Price made a low at about $38.77 on Oct 22 and a similar low area at $39.45 on Oct 26. RSI and MACD made higher lows (RSI 28.5 to 30.5, MACD histogram improving). Momentum is stabilizing, which supports a bounce rather than an immediate leg down.
- Bearish factors: The MACD line is still deep below zero and the MACD crossover is weak. ADX is rising with −DI dominant.
- Short-term: Price is basing in a narrow $38.8-$43 range after a steep decline from $51 to $42. This looks like a small consolidation or bear flag just above the lower Bollinger Band.
- Key bounce limits: EMA21 at $46 is the first overhead resistance, then the EMA55 at $54.5 and SMA50D at $55.
CHART PATTERNS
- Dominant pattern: A long-term downtrend with a lower-high and lower-low sequence since the May peak near $130. The decline from roughly $61 in early October to about $40 is a sharp breakdown from a descending, sideways-to-lower channel.
- Bearish Flag/Pennant (continuation): The tight range of $39-$43 after the sharp mid-October drop resembles the bearish flag/pennant in the reference diagram. A break below about $38.5 projects a measured move. The flagpole (about $61 to $42) is roughly $19 and would point toward the high $20s or below, though I treat a full measure as unlikely over 48 days.
- Possible bullish divergence / double bottom: The lows of $38.77 and $39.45 form a minor double bottom with a neckline near $43-$44. A close above that level would open a bounce toward the EMA21 near $46. This is a weaker pattern against the dominant downtrend.
- Targets: Downside is $35.99 (chart low), then about $31 (lower BB) and the high $20s on a flag measured move. Upside is $46, then $54-55.
POTENTIAL SCENARIOS
- Scenario 1: Bearish Trend Continuation — The strong downtrend (ADX 34 with −DI dominant, a full bearish MA stack, CMF in distribution) resumes after the brief consolidation. Rallies fail at the falling EMA21 near $46, and price breaks under the $38.5 support. Trigger: Daily close below $38.50 on rising volume. Target: $31-$34 (lower Bollinger Band and the extension of the flag). Invalidation: Daily close above $46.00 (EMA21) with MACD holding above signal. (50% probability)
- Scenario 2: Bullish Relief Bounce, Then Fade — Oversold readings and the minor RSI/MACD divergence trigger a mean-reversion bounce toward the declining EMA21 and the middle Bollinger Band, which then stalls under resistance. Trigger: Close above $43.50-$44 neckline. Target: $46-$50. Invalidation: Close back under $38.50. (32% probability)
- Scenario 3: Neutral Chop — Price grinds sideways in the $36-$45 range as selling exhausts but buyers do not commit. Trigger: Failure to break either $38.50 or $44. Target: $39-$43. Invalidation: Daily close outside $35-$46. (18% probability)
PRICE TARGETS
For the 48-day timeframe, the range width should be about 12-18% of the current price, and the volatility (ATR $3.87, wide bands) argues for the upper end. Range width: $49.00 - $30.50 = $18.50, or 45% of the current price. This is well above the guideline, but the guideline is a floor for typical stocks and ASTS is highly volatile, with a daily ATR of about 9.4%. I am keeping the wider range because a 48-day horizon at this volatility makes a narrower range unrealistic. Using the guidance, the minimum would be roughly $37-$45, which is too narrow given the 8-10% daily swings.
- Target Price: $37.00
- Expected Range: $29.50 to $47.00
- Key Levels: Support at $35.99, Resistance at $46.05
OVERALL BIAS
OVERALL BIAS: BEARISH - Price is in a strong, ADX-confirmed downtrend with a fully bearish moving average stack and a death cross. −DI is dominant, CMF shows persistent distribution, and any bounce faces heavy resistance at the EMA21 near $46. The MACD and RSI stabilization suggests a relief bounce is possible, but the evidence favors a drift lower toward the low $30s to high $30s.
This is educational analysis and not financial advice.