INTC 48-day bearish forecast — Nov 1, 2026
- Bias: Bearish
- Timeframe: 48 days (made Nov 1, 2026, target date Dec 18, 2026)
- Price at analysis: $65.76
- Price target: $62.50
- Expected range: $56.50 – $68.00
- Result: Pending — graded after the close on Dec 18, 2026
Get a free AI analysis of INTC today
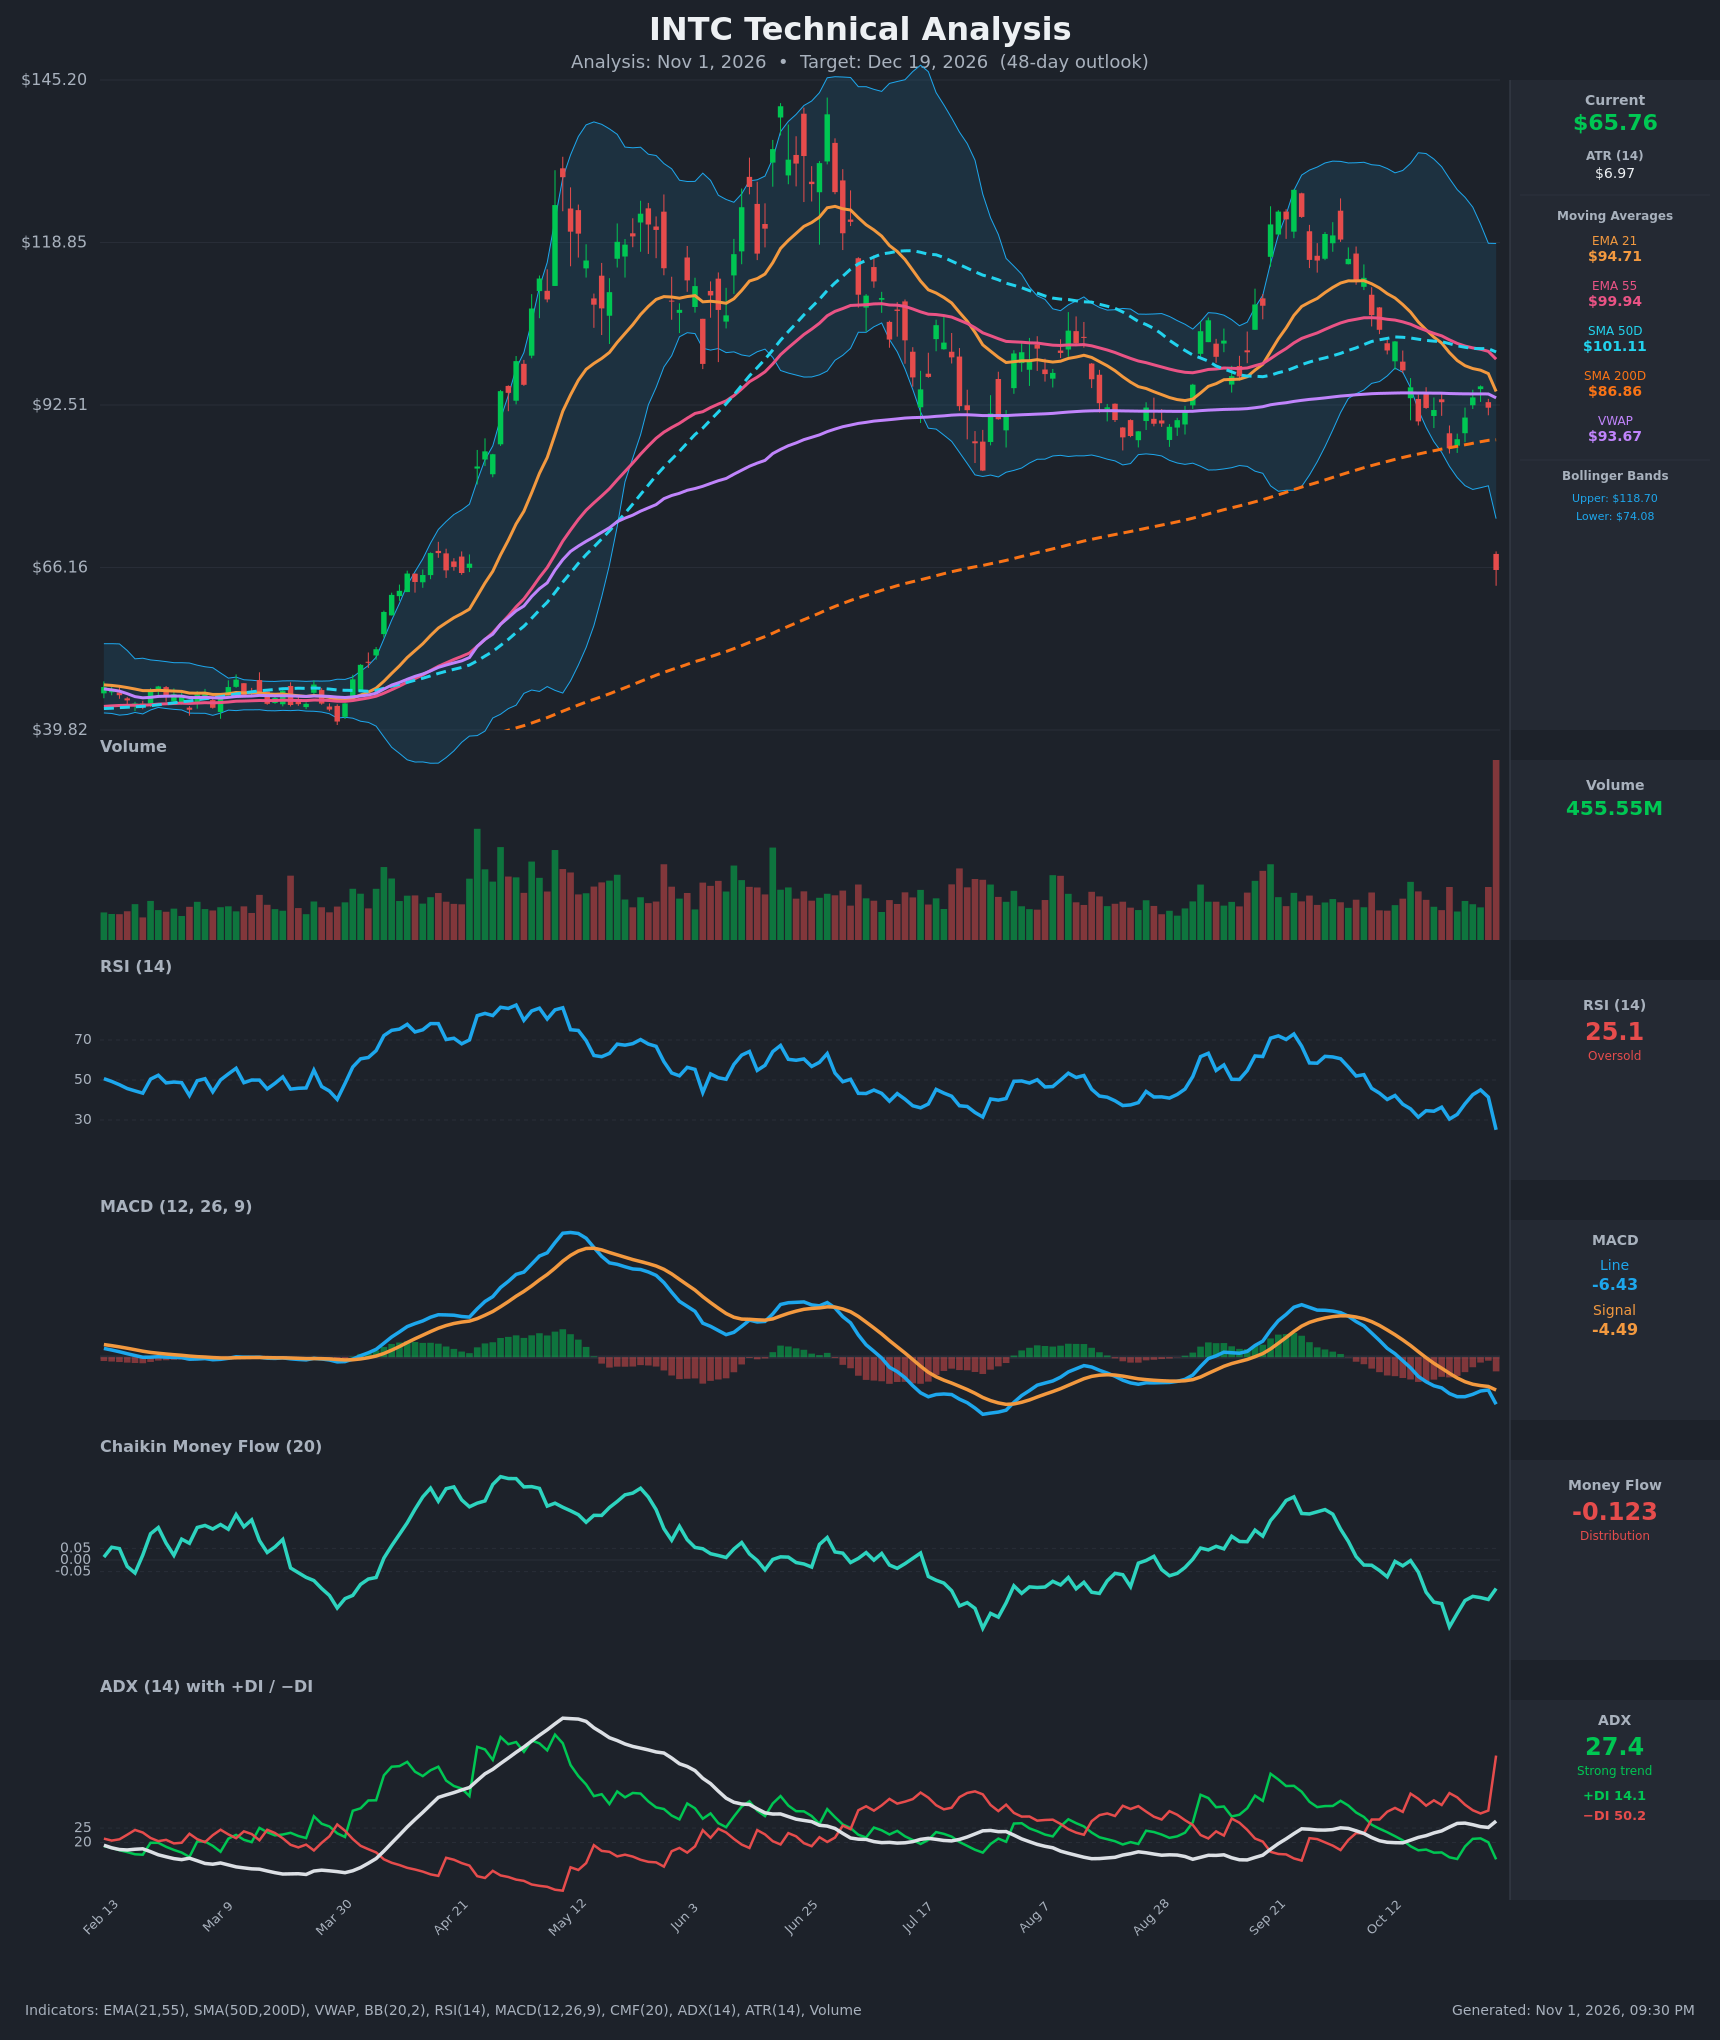
Analysis
TECHNICAL INDICATORS
- RSI (14): 25.10, deeply oversold. It collapsed from 41.5 to 25.1 in a single session and sits below the prior swing low near 30. Momentum is violently negative, but the reading is stretched enough to allow a relief bounce. [Bearish]
- 20 EMA (EMA 21): $94.71. Price at $65.76 is about 30% below it, and the EMA is sloping down sharply. It is far overhead resistance. [Bearish]
- MACD: Line -6.43 is below the signal at -4.49, and the histogram is widening negative. The bearish crossover happened around Oct 19 and has just been reinforced by the gap down. [Bearish]
- Bollinger Bands (20): Upper $118.70 and lower $74.08. Price is well outside the lower band, about 11% below it. That is a statistical extreme that often precedes a bounce toward the mean. In a news-driven gap, though, it can also mark the start of a band walk. The bands are widening after the shock. [Neutral]
- CMF (20): -0.123, below the -0.05 threshold and falling from -0.17. Sustained distribution since early October. [Distribution]
- ADX (14): 27.4 and rising, with -DI at 50.2 against +DI at 14.1. This is a strong trend with the bears firmly in control, and the DI spread is very wide (a 36-point gap). [Strong Trend – Bearish]
- Volume: 455.55M, by far the largest bar on the chart. It is a heavy-volume gap down (about -28.6% in one day) that signals institutional repricing, likely on a fundamental catalyst. It is also a potential selling climax, but follow-through is needed to confirm a bottom. [Bearish with capitulation risk]
Other moving averages and levels:
- EMA 55 / SMA 50D / VWAP: $99.94, $101.11 and $93.67, all far above price. EMA 21 is below EMA 55 (a bearish cross confirmed on Oct 19-20).
- SMA 200D: $86.86. Price lost this long-term support with a gap and is now about 24% below it.
- SMA 50D vs SMA 200D: SMA 50D is still above SMA 200D, so there is no death cross yet, but the 50D is rolling over.
DIVERGENCES & TRENDS
- There is no bullish RSI divergence yet. RSI made a lower low (25.1 versus roughly 30 in mid-October) along with price, so momentum confirms the decline.
- The MACD line is making new lows, below its mid-year trough, which confirms the downtrend.
- CMF has made a lower low since the September peak, a persistent distribution trend that preceded the gap.
- ADX has risen from about 20 to 27.4 while -DI exploded higher, so trend strength is expanding to the downside.
- The prior bearish crossovers were EMA 21 under EMA 55, MACD under signal, and price under SMA 200D. The gap through the 200D with no consolidation is a major trend break.
- Price is extremely extended below the lower Bollinger Band and has an oversold RSI, so a mean-reversion bounce is likely at some point. Such bounces usually stall well below the broken averages.
CHART PATTERNS
- Bearish Double Top (reversal): The June peak near $140 and the September peak near $125-128 form a lower-high double top. The neckline sits around $85-92, the August-October lows, and it has now broken decisively. The measured move (about $45-50 height) points toward the $40-45 base from Feb-Mar. That is a long-term target, and 48 days would only cover a portion of it.
- Gap down breakdown: There is a large breakaway gap from $92 to about $66, with a gap zone of roughly $66-92 overhead. Gaps like this are rarely filled quickly. Partial retracements typically stall near the lower Bollinger Band ($74) or the gap midpoint.
- Bearish Flag/Pennant potential: If a relief bounce forms a tight, low-volume, upward-sloping consolidation over the next 2-3 weeks, it would match the Bearish Flag Pattern. That would imply continuation lower.
POTENTIAL SCENARIOS
- Scenario 1: Bearish Post-Gap Drift / Lower Low — After the climactic gap, a weak dead-cat bounce fades below $74 as the trend indicators (ADX, DI, MACD, CMF) keep pressing. Price retests and breaks the gap-day low and grinds toward the low $60s or high $50s. Trigger: failure to reclaim $74 (lower Bollinger Band) and a close below about $63. Target: $58-$62. Invalidation: daily close above $78 on rising volume. (45% probability)
- Scenario 2: Bullish Oversold Relief Rally — RSI at 25, price far below the lower band, and a volume climax prompt a sharp mean-reversion bounce that fills part of the gap. Trigger: close above $70 followed by a break of the $74 band. Target: $76-$82, near the gap midpoint and approaching the 200D at $86.86. Invalidation: loss of $63. (30% probability)
- Scenario 3: Neutral Basing Range — Price stabilizes in a wide post-shock range as volatility contracts and volume fades. Trigger: several closes holding between $60 and $72. Target: $64-$68. Invalidation: close outside $58-$74. (25% probability)
PRICE TARGETS
- Target Price: $62.50 (48 days, Dec 19, 2026)
- Expected Range: $56.50 to $68.00 (width $11.50, about 17.5% of current price, consistent with the 30-60 day guidance)
- Key Levels: Support at $60.00 (psychological level, just below the gap-day low), Resistance at $74.08 (lower Bollinger Band and the first gap-fill zone)
OVERALL BIAS
OVERALL BIAS: BEARISH - Price gapped below every moving average, including the SMA 200D, on record volume. MACD, CMF and ADX/DI (-DI 50.2 versus +DI 14.1) all confirm strong downside control. The oversold RSI (25.1) and extension below the lower Bollinger Band make a relief bounce likely, but that bounce probably meets heavy overhead supply, so I favor a modest net decline over 48 days.
This is educational analysis and not financial advice.