META 48-day bearish forecast — Nov 1, 2026
- Bias: Bearish
- Timeframe: 48 days (made Nov 1, 2026, target date Dec 18, 2026)
- Price at analysis: $614.99
- Price target: $592.00
- Expected range: $548.00 – $646.00
- Result: Pending — graded after the close on Dec 18, 2026
Get a free AI analysis of META today
Analysis
TECHNICAL INDICATORS
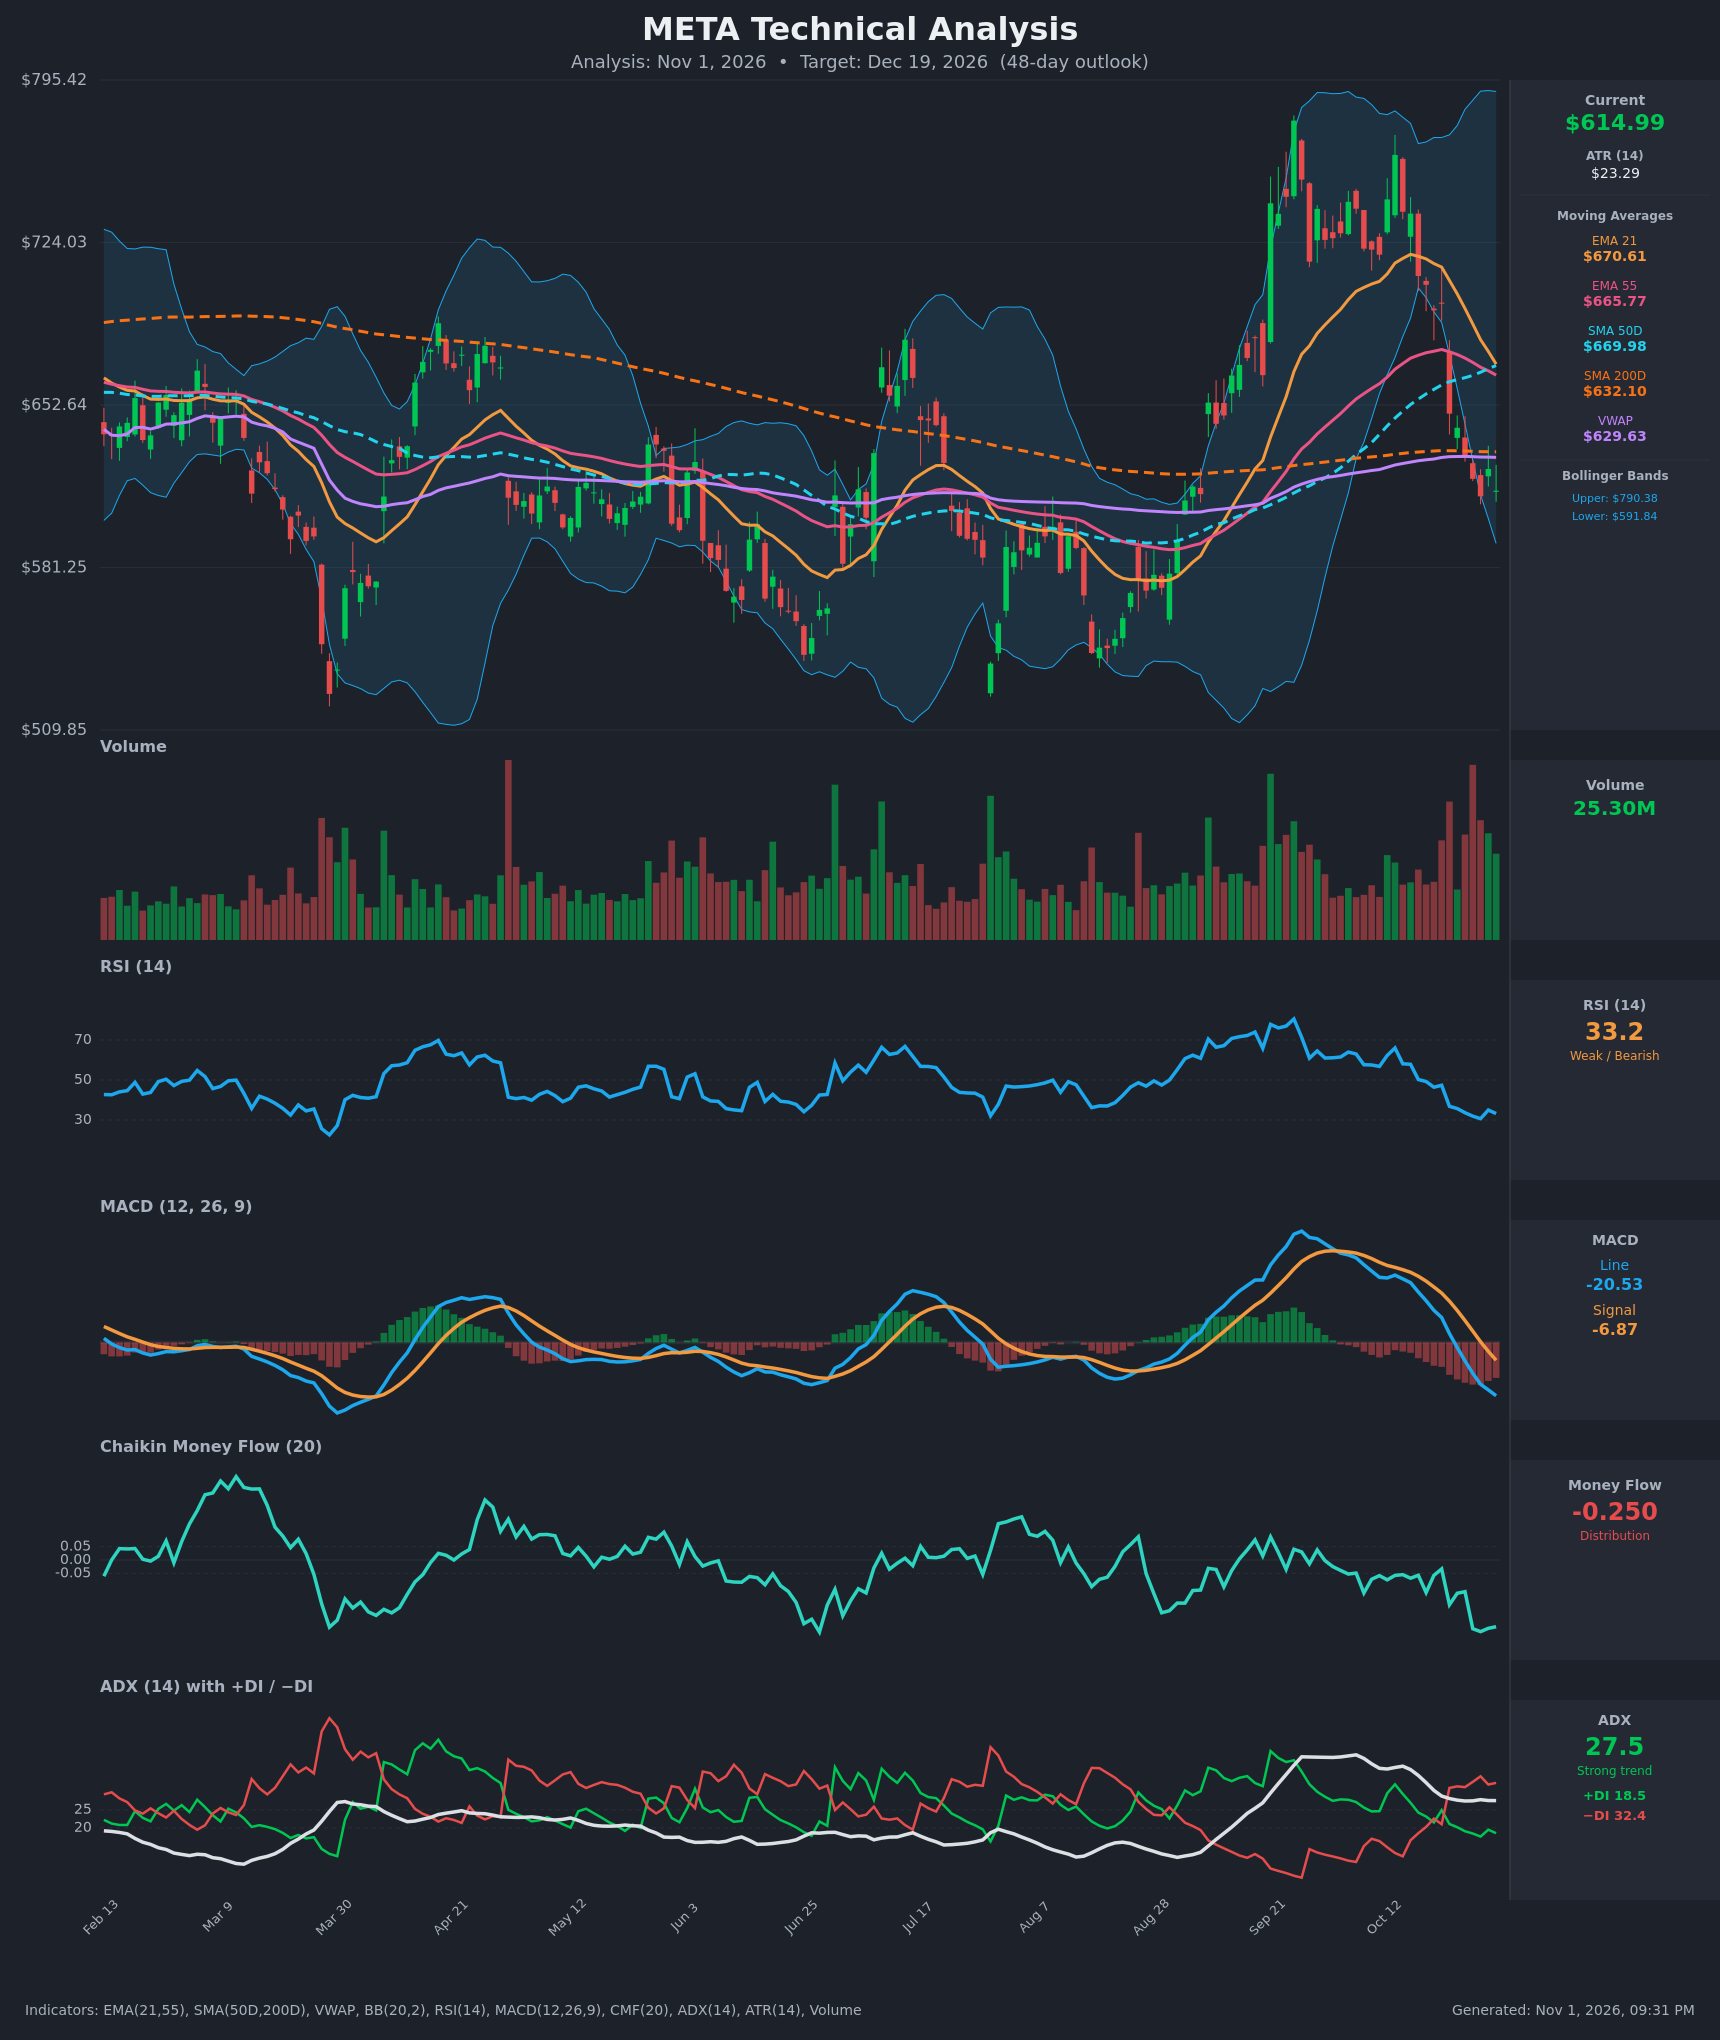
- RSI (14): 33.21, down from 62 on Oct 12 and just off the 30.7 low on Oct 28. It is near oversold but not yet at an extreme, and momentum is still pointing down. Oversold readings can persist in a strong downtrend. [Bearish]
- 20 EMA: The data gives EMA 21 at $670.61, with price at $614.99 about 8% below it, so it acts as overhead resistance. EMA 21 is falling quickly (from $718.82 on Oct 15) and is converging on EMA 55 at $665.77. A bearish EMA21/55 cross looks imminent. [Bearish]
- MACD: The line is -20.53 and the signal is -6.87, with the histogram about -13.7 and still widening. The bearish crossover happened around Oct 23 and both lines are below zero and falling, with no sign of a bottom yet. [Bearish]
- Bollinger Bands (20): The upper band is $790.38 and the lower is $591.84, so the bands are very wide after the Sept–Oct volatility spike. Price at $614.99 sits in the lower quarter of the bands, about $23 (roughly 1 ATR) above the lower band. It is neither a squeeze nor a confirmed band-walk. A tag of the lower band is likely, and a bounce there would be modest. [Bearish]
- CMF (20): -0.250, well below the -0.05 threshold. It has been persistently negative and fell from about -0.06 to -0.25 over the last 10 sessions. This is heavy distribution, and the chart shows it near its lowest levels of the period. [Distribution]
- ADX (14): 27.5, which is above 25 and signals a strong trend. −DI (32.4) is well above +DI (18.5), and the DI cross to bearish happened on Oct 22. ADX has been drifting down from 37, so trend strength is easing slightly while the direction stays down. [Strong Trend – Bearish]
- Volume: 25.30M on the latest bar. Volume was elevated on the late-Oct red candles, and the chart shows several of the largest bars of the year during the decline. That is selling pressure with conviction, and there are no capitulation-style spikes or reversal candles yet. [Bearish – Distribution]
Other moving averages and levels:
- Price is below VWAP ($629.63), SMA 50 ($669.98) and SMA 200 ($632.10). Breaking below the 200-day is a long-term bearish shift.
- The SMA 50 is still above the SMA 200 (no death cross yet), but the 50-day is now rolling over.
DIVERGENCES & TRENDS
- Divergences: There is no bullish RSI or MACD divergence. RSI and MACD are making lower lows in line with price. The one mild positive is that RSI is approaching oversold, which sets up a relief bounce but not a reversal.
- Trend:
- The Aug–Oct rally (about $570 to a $790 area peak) has fully reversed.
- Price has fallen from $762 (Oct 13) to $615 (Oct 30), a drop of about 19%.
- EMAs and the 50-day are rolling over. The MACD bearish crossover and the −DI over +DI cross are both confirmed.
- Crossovers and breaks:
- MACD crossed bearish around Oct 23.
- −DI crossed above +DI on Oct 22.
- Price broke below EMA 21, EMA 55, SMA 50, SMA 200 and VWAP between Oct 22 and Oct 30.
- EMA 21 is about to cross below EMA 55.
- Oct 29 saw a one-day bounce to $624.52 that failed at $630 (VWAP/SMA 200), which is a bearish retest.
CHART PATTERNS
- Bearish Double Top (reference diagram): The two peaks near $770–790 in late Sept and about $762 on Oct 13 look like a double top, and price has since broken down through the middle of the structure. If this reading is right, the pattern's measured move points to lower prices, consistent with a test of the mid-$500s or a move toward the lower-$590s first. This is an approximate read, not a textbook pattern.
- Context: Price is sitting on the SMA 200/VWAP zone ($630) from below, so that zone has flipped to resistance. The prior consolidation floor is at $580–$590, matching the lower Bollinger Band ($591.84), and that is the first realistic support.
- Failure condition: A reclaim of $632–$640 on volume would negate the double-top breakdown and suggest a bear trap.
POTENTIAL SCENARIOS
- Scenario 1: Bearish Continuation to Prior Support — Distribution (CMF -0.25), a bearish MACD and −DI dominance point to more downside. The 200-day/VWAP zone caps rallies and price grinds toward the lower Bollinger Band and the $580 support. A relief bounce from the oversold RSI fails below $632. Trigger: a daily close below $591.84 (lower BB) with continued high volume. Target: $575–$595, with an extension to about $550. Invalidation: a daily close above $640. (50% probability)
- Scenario 2: Bullish Oversold Relief Rally — RSI near 30 and the lower-band proximity trigger mean reversion, and price reclaims the 200-day SMA and VWAP. It then rallies toward the falling EMAs. Trigger: a close above $632 with improving CMF and a MACD histogram that stops widening. Target: $655–$670 (EMA 55/SMA 50 cluster). Invalidation: a close back below $600. (30% probability)
- Scenario 3: Neutral Base Building — Price chops between roughly $580 and $632 as selling exhausts and the trend cools (ADX is easing). Trigger: repeated holds at $590 with declining volume. Target: $600–$625. Invalidation: a decisive close outside the $575–$640 range. (20% probability)
PRICE TARGETS
For the 48-day timeframe (to about Dec 19, 2026), I expect a modest net decline. Any oversold bounce is likely capped near the $630 resistance, and trend and flow indicators favor a retest of lower support. The magnitude is moderated by the oversold RSI and the proximity of the $580–$592 support.
- Target Price: $592.00
- Expected Range: $548.00 to $646.00 (width $98, about 15.9% of the current price, in line with the 30–60 day guidance)
- Key Levels: Support at $581.25, Resistance at $632.10
OVERALL BIAS
OVERALL BIAS: BEARISH - Price is below every major moving average and VWAP, with a bearish MACD cross, −DI dominance at ADX 27.5, and heavy distribution (CMF -0.25). RSI near 33 limits the size of the decline, so I expect a drift toward the $580–$592 support rather than a collapse.
This is educational analysis and not financial advice.