MU 48-day bearish forecast — Nov 1, 2026
- Bias: Bearish
- Timeframe: 48 days (made Nov 1, 2026, target date Dec 18, 2026)
- Price at analysis: $884.74
- Price target: $850.00
- Expected range: $775.00 – $925.00
- Result: Pending — graded after the close on Dec 18, 2026
Get a free AI analysis of MU today
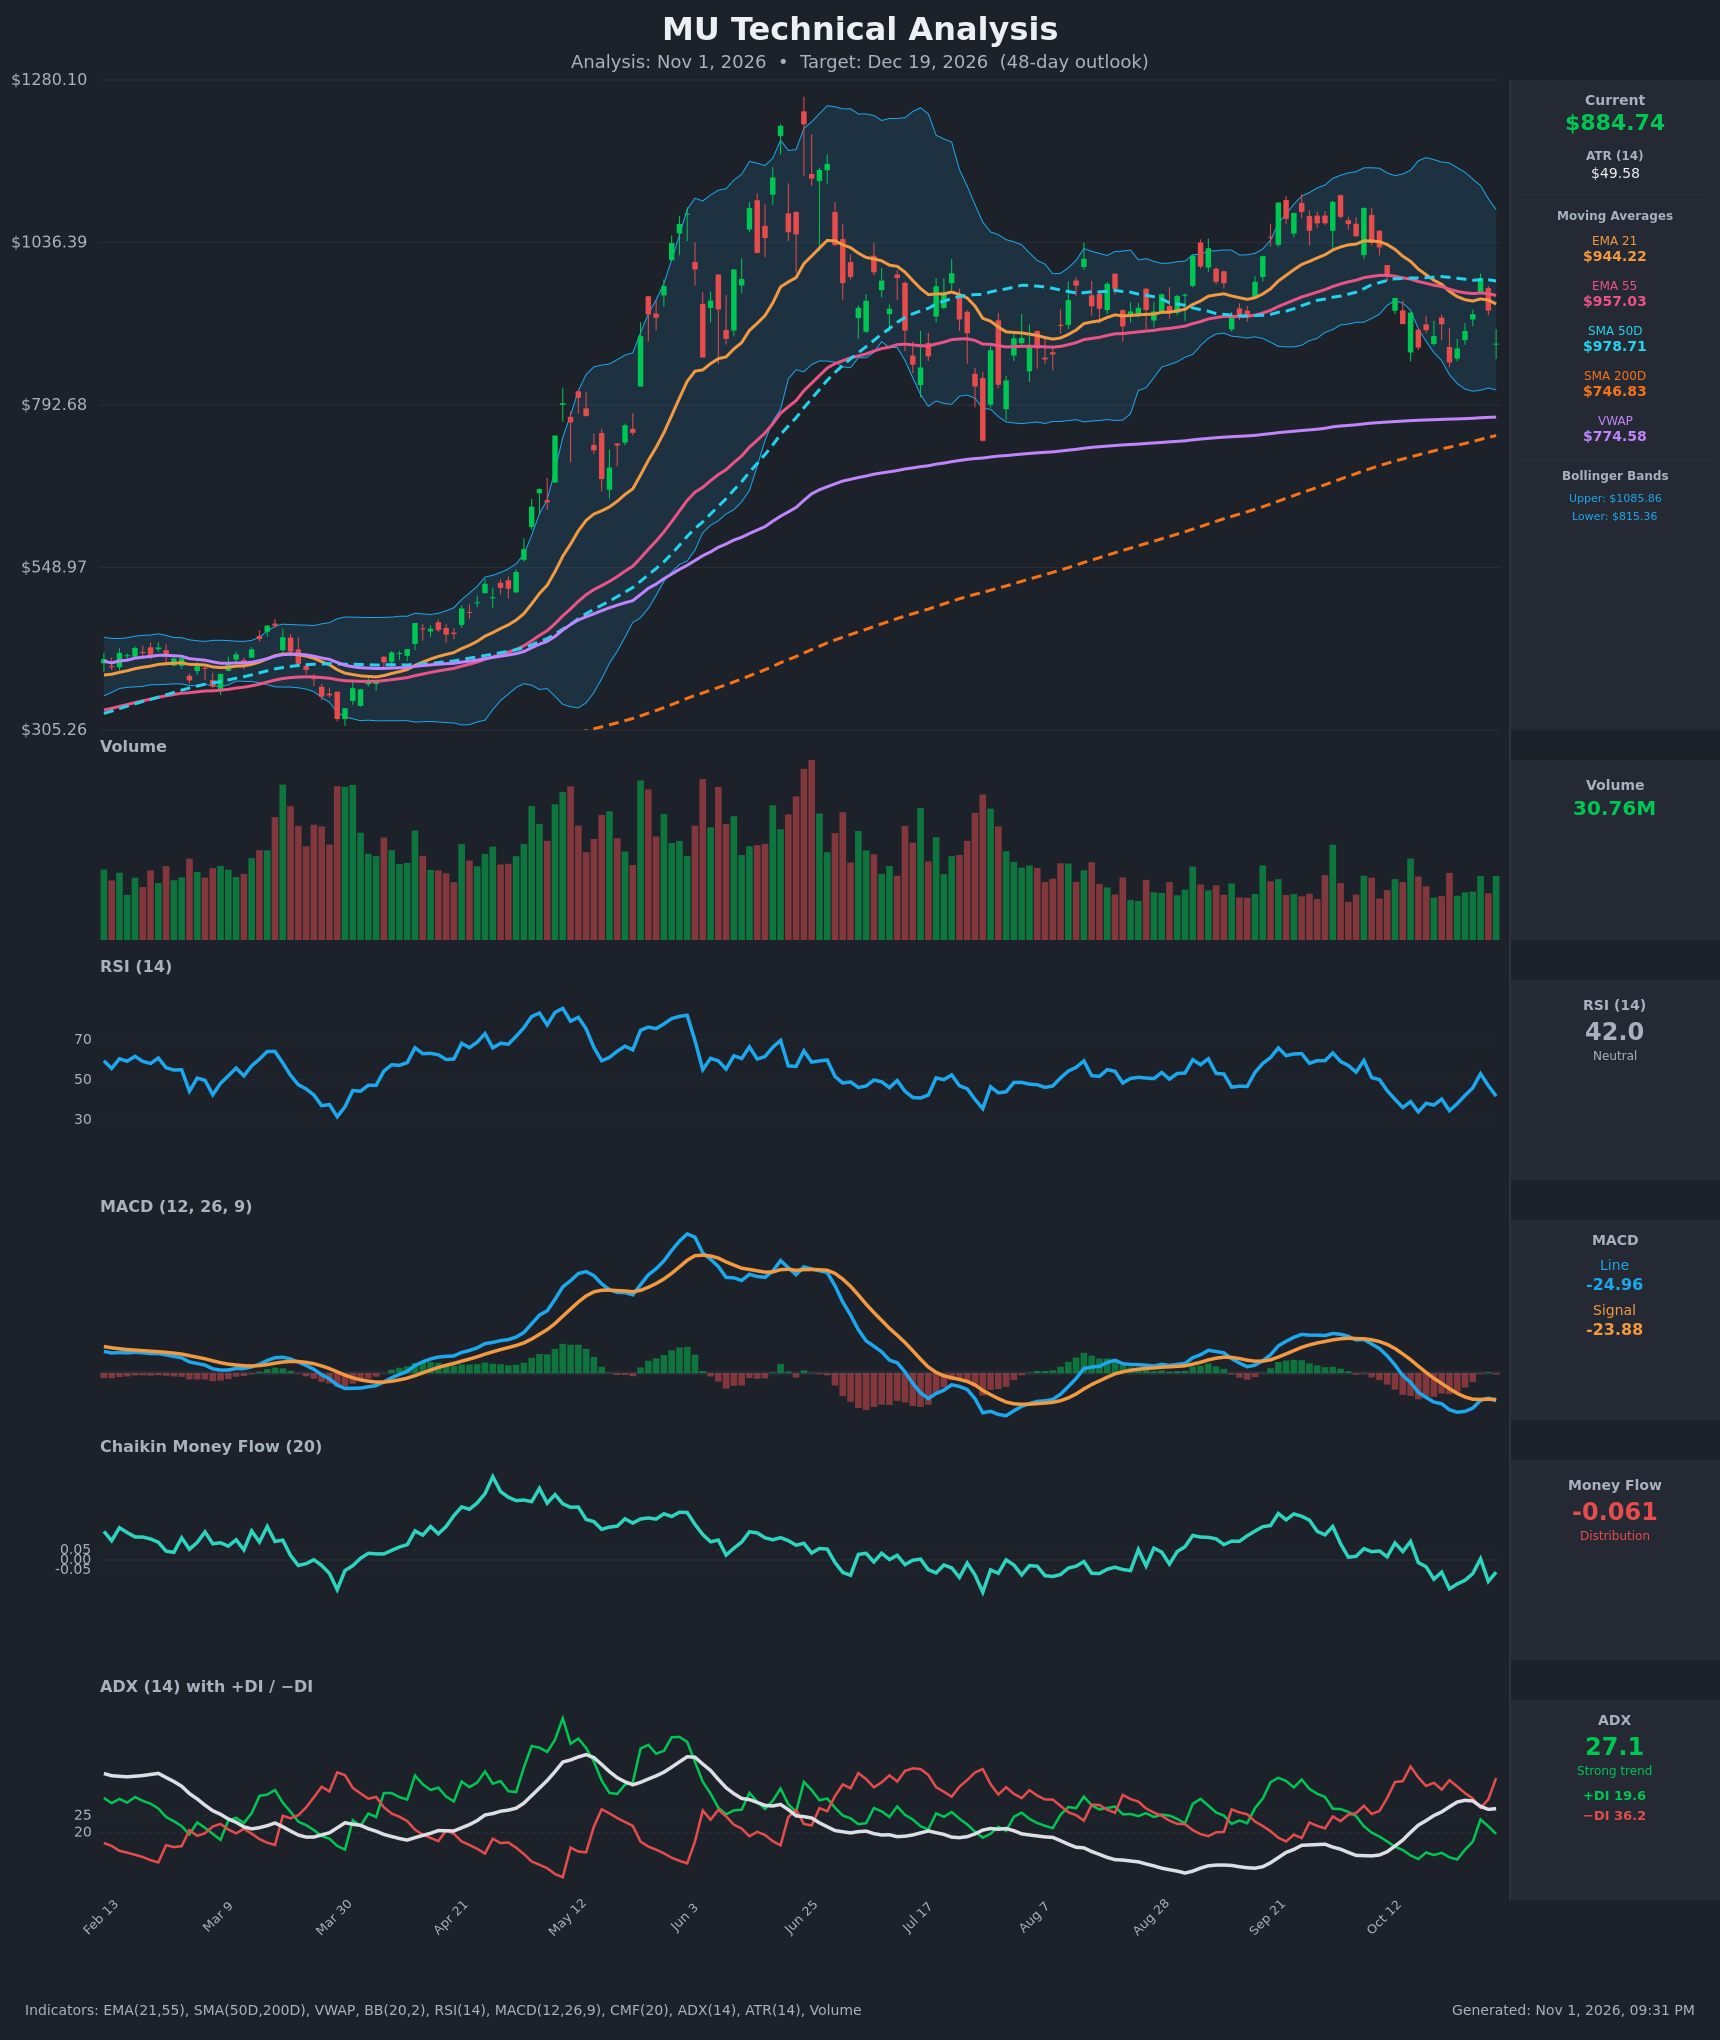
Analysis
TECHNICAL INDICATORS
- RSI (14): 41.98, below the 50 midline and well off the Oct 28 high of 53.2. It has made lower highs since the Oct 12 reading of 44.7 and is not oversold, so there is room to fall further. [Bearish]
- 20 EMA (EMA 21): $944.22, with price (~$884.74) about 6% below it. EMA21 crossed below EMA55 ($957.03) around Oct 22, a bearish crossover. Both EMAs now act as overhead resistance. [Bearish]
- MACD: Line -24.96 is below Signal -23.88. The line briefly rose toward the signal on Oct 28-29 and has now rolled back under it. Both are negative and the histogram has flipped slightly negative, so momentum is weak with no bullish reversal yet. [Bearish]
- Bollinger Bands (20): Upper $1085.86, lower $815.36, midline about $950. Price sits in the lower half, roughly 26% of the band width above the lower band. The bands are wide, which means high volatility, and the price rejection from the midline favors a test of the lower band. [Bearish]
- CMF (20): -0.061, below the -0.05 threshold. It has been mostly negative since mid-October, with a brief spike to +0.006 on the Oct 28 bounce. This shows mild but persistent distribution. [Distribution]
- ADX (14): 27.1 and rising from the mid-teens in early October. -DI (36.2) is far above +DI (19.6), so bears are firmly in control of a strong trend. [Strong Trend – Bearish]
- Volume: 30.76M, below the heavy volume of the spring rally. Volume has been fading since July and shows no capitulation spike. Selling is steady rather than panicked, so there is no exhaustion signal yet. [Neutral to mildly bearish]
DIVERGENCES & TRENDS
- No clear bullish divergence. Price made a lower low on Oct 22 ($856.49), and RSI (34.7) and MACD (-33.2 to -35.4) confirmed it rather than diverging.
- The trend in the indicators is deteriorating: ADX is rising, -DI is dominant, and CMF is negative.
- Price has a lower high structure: the June peak was above $1200 and the Sept/Oct peak was about $1100.
- The EMA21/EMA55 bearish crossover has occurred, and price is also below SMA50D ($978.71).
- Price remains above SMA200D ($746.83) and VWAP ($774.58), so the long-term uptrend is intact. SMA50D is still above SMA200D, so there is no death cross.
- The Oct 28 bounce to $983 failed at the 50D/EMA cluster. This is a classic bearish rejection.
CHART PATTERNS
- Bearish Double Top / lower-high structure: There are two major peaks, about $1200 in June and about $1100 in Sept. Price has since broken below the Oct support area of about $900-$920 and keeps making lower highs. The neckline of the broader range sits near $780-$800 (the July/Aug lows). A break would imply a larger measured move toward $650-$700, which is a long-term risk beyond this window.
- Range/Rising wedge-like consolidation: Price has traded between roughly $780 and $1100 since July. It currently sits in the lower half of that range, with momentum pointing toward the lower boundary.
- The first target is the lower Bollinger Band at about $815. Further support is VWAP at about $775 and SMA200D at about $747.
POTENTIAL SCENARIOS
- Scenario 1: Bearish Drift to Range Support — Momentum, DI dominance, and the EMA crossover push price toward the lower Bollinger Band and the July/Aug range lows. Trigger: a close below $856 (the Oct 22 low). Target: $815, then $775-$790 (VWAP and range low). Invalidation: a daily close above $957 (EMA55). (50% probability)
- Scenario 2: Neutral Chop in the $850-$950 Zone — Price stabilizes after the oversold-ish dip and ranges between the lower band and the EMA21. Trigger: holding $856-$870 with RSI stabilizing near 40-45. Target: $880-$930. Invalidation: a close below $850 or above $960. (22% probability)
- Scenario 3: Bullish Rebound Reclaiming Moving Averages — Buyers defend the range and the MACD turns back up, driving price through the EMA cluster. Trigger: a close above $944-$957 on rising volume with CMF above +0.05. Target: $980 (SMA50D), then $1,040-$1,085 (upper band). Invalidation: a failure back below $900. (28% probability)
PRICE TARGETS
- Target Price: $850.00 (48-day horizon, Dec 19, 2026)
- Expected Range: $775.00 to $925.00. The width is $150, or about 17% of the current price, consistent with the 30-60 day guidance.
- Key Levels: Support at $815.36 (lower Bollinger Band; below that $774.58 VWAP and $746.83 SMA200D). Resistance at $944.22 (EMA21; above that $957.03 EMA55 and $978.71 SMA50D).
OVERALL BIAS
OVERALL BIAS: BEARISH - Price sits below the EMA21, EMA55 and SMA50D after a bearish EMA crossover. MACD is below its signal, CMF shows distribution, and ADX at 27 with -DI at 36 vs +DI at 20 confirms a strong downtrend. The most likely path is a drift toward the $815 lower band and the $775 VWAP area, while the long-term trend above SMA200D limits deeper downside within this window.
This is educational analysis and not financial advice.