USO 48-day bullish forecast — Nov 1, 2026
- Bias: Bullish
- Timeframe: 48 days (made Nov 1, 2026, target date Dec 18, 2026)
- Price at analysis: $168.83
- Price target: $174.50
- Expected range: $152.00 – $183.00
- Result: Pending — graded after the close on Dec 18, 2026
Get a free AI analysis of USO today
Analysis
TECHNICAL INDICATORS
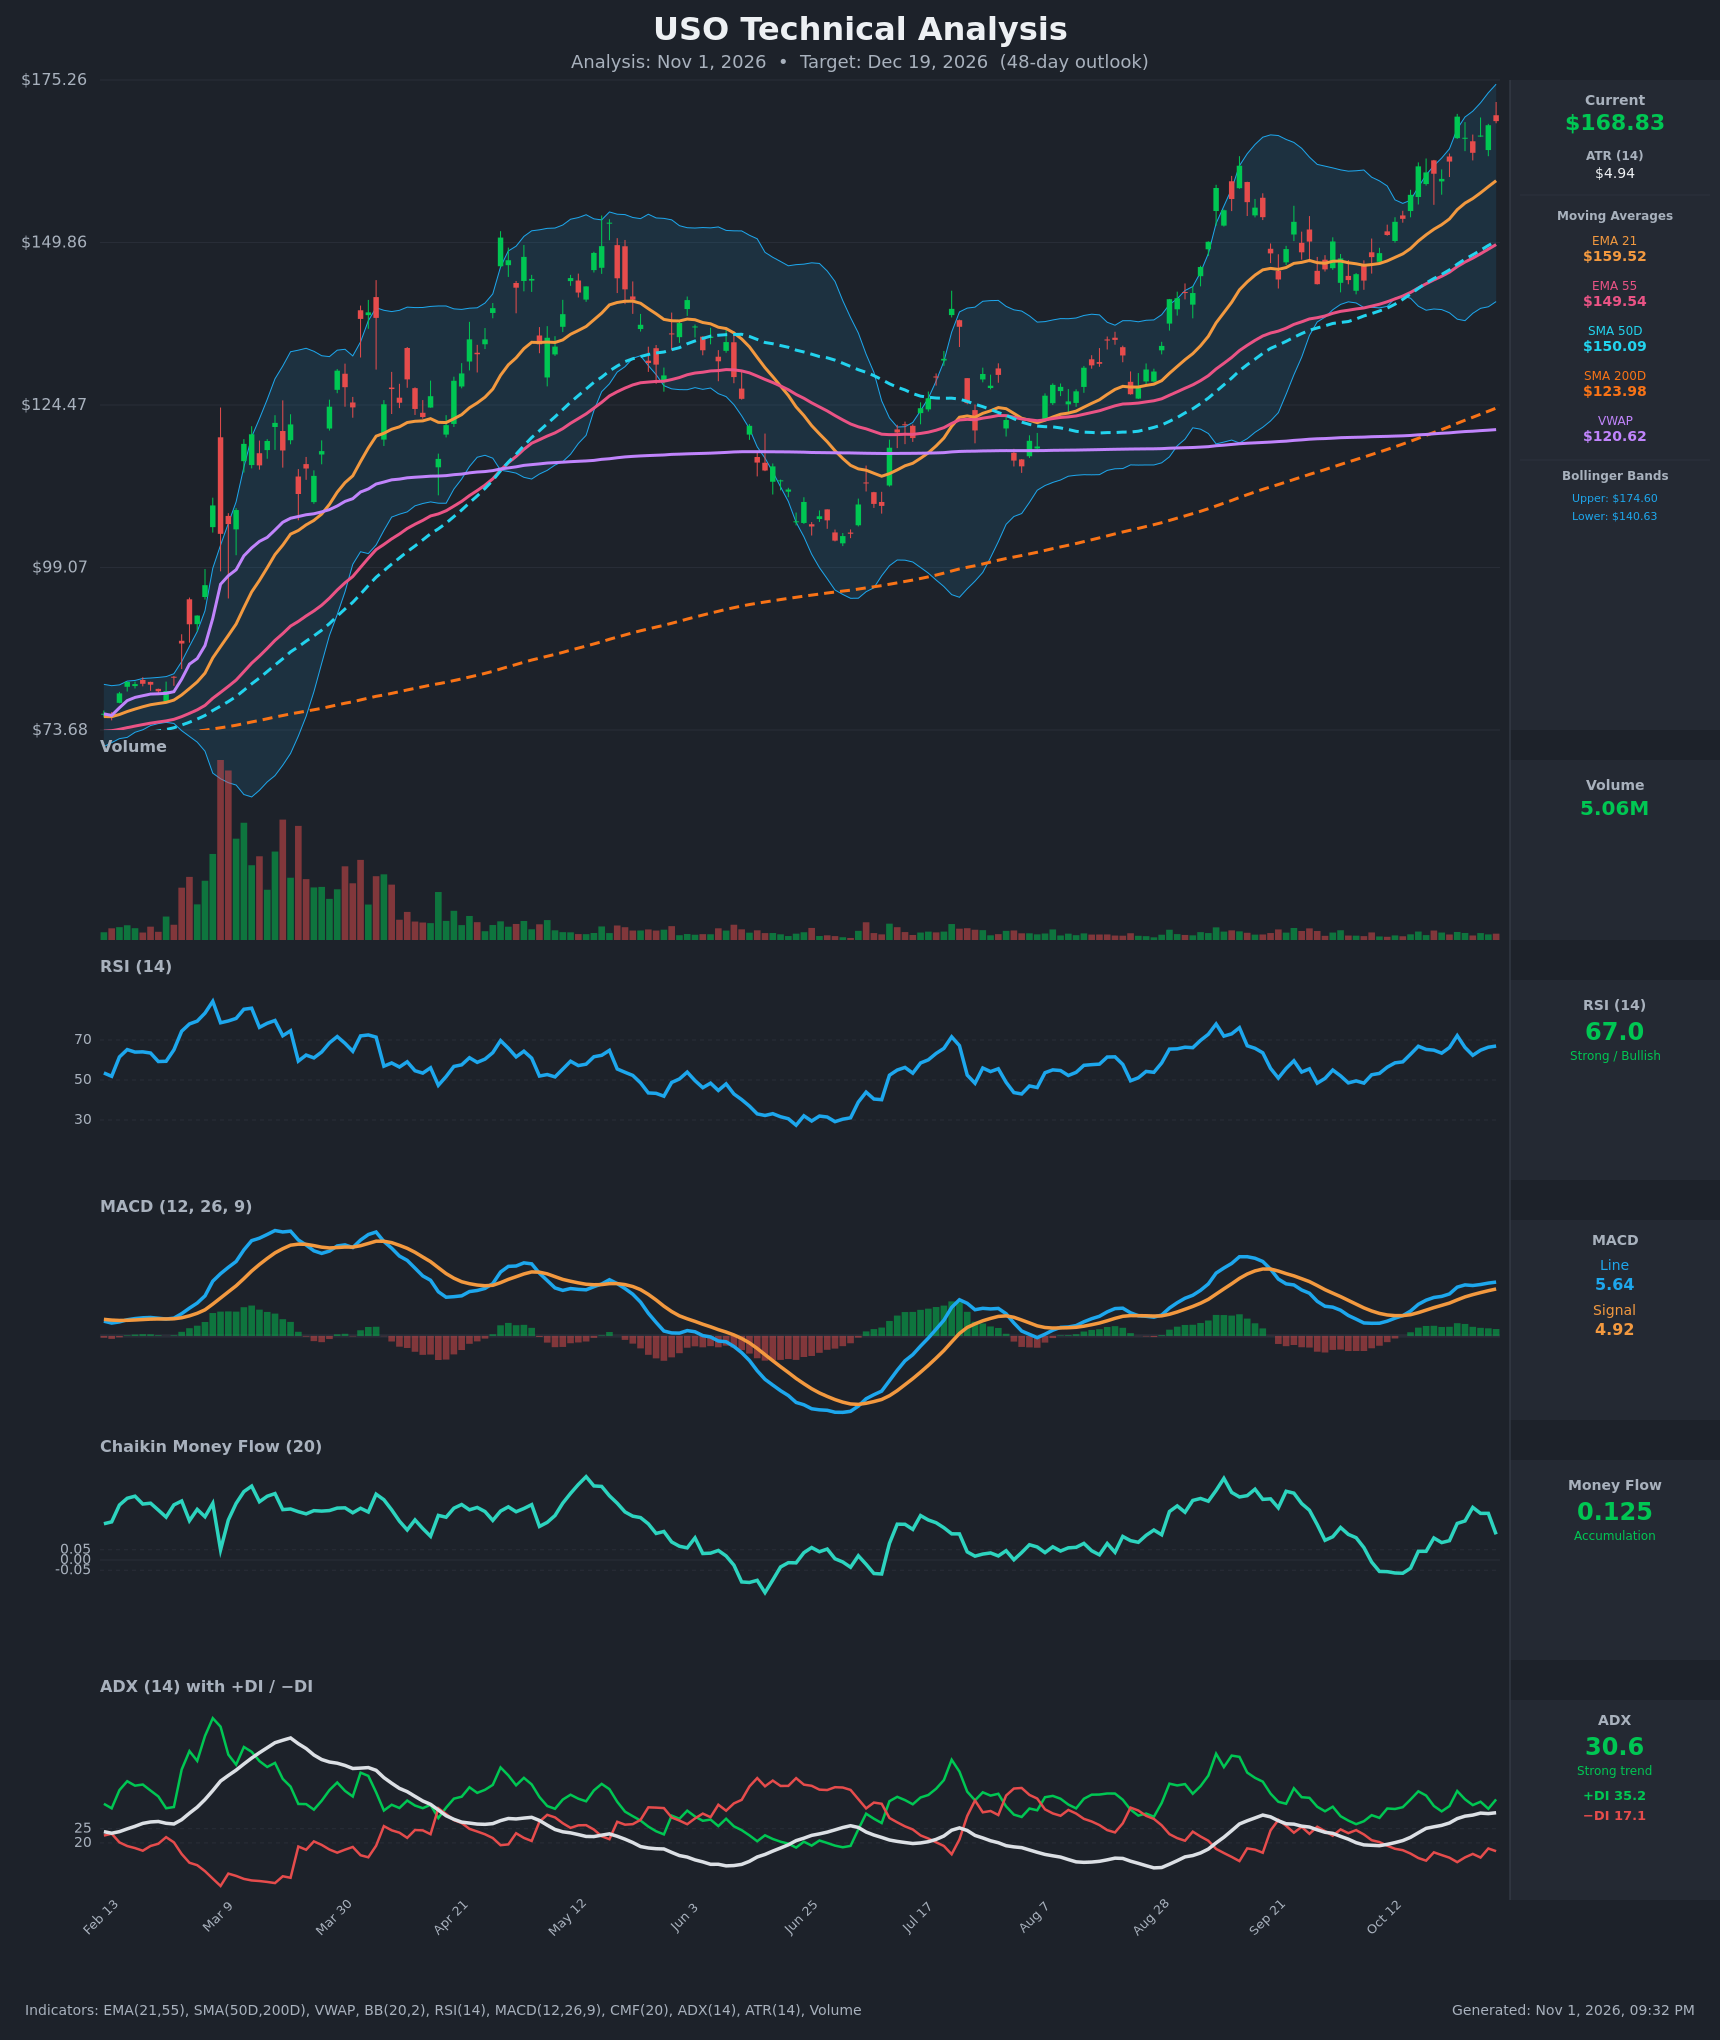
- RSI (14): 66.98, just below overbought and in bullish territory. It has held above 60 for most of the past two weeks, with a brief spike to 72.2 on Oct 23. Price is making higher highs while RSI is not exceeding its prior peaks, a minor momentum caveat. [Bullish]
- 20 EMA (EMA 21): $159.52, rising steadily. Price at $168.83 is about $9.30 (5.8%) above it, so the EMA is dynamic support. EMA 21 is also well above EMA 55 ($149.54), a bullish alignment that has been in place for months. [Bullish]
- MACD: Line 5.639 is above Signal 4.918, a positive spread of about 0.72. The histogram is positive and has widened over the past two weeks, with the line making higher highs. This is a bullish crossover that has persisted since late September. [Bullish]
- Bollinger Bands (20): Upper $174.60, lower $140.63, so the midline is about $157.6. Price sits in the upper quarter of the band, about $5.80 below the upper band, and has been riding the upper half. Bands are wide, which indicates elevated volatility. Walking the band is a trend-strength signal, but price is extended from the midline and a pullback toward it is possible. [Bullish]
- CMF (20): 0.125, above the +0.05 threshold. It has been positive since Oct 16 and peaked at 0.256 on Oct 27, so it has faded a bit while price pushed higher. That is mild cooling, but accumulation is still in place. [Accumulation]
- ADX (14): 30.6 and rising from 19.5 on Oct 12, so trend strength is building. +DI at 35.2 is well above −DI at 17.1, a spread of about 18, so bulls are firmly in control. [Strong Trend + Bullish]
- Volume: 5.06M. Volume has been low and steady since the huge spike in February and March, with no climactic buying or selling. The rally is advancing on modest volume, which supports the trend but gives less confirmation of a breakout. [Neutral to mildly supportive]
DIVERGENCES & TRENDS
- Moving average structure: Price ($168.83) > EMA 21 ($159.52) > SMA 50D ($150.09) ≈ EMA 55 ($149.54) > SMA 200D ($123.98) > VWAP ($120.62). This is a fully bullish stack. The golden cross (SMA 50D over SMA 200D) is long established, and the SMA 50D has just caught up to the EMA 55.
- Long-term trend: Price is about 36% above the SMA 200D, a stretched reading that raises mean-reversion risk, though it is not a timing signal.
- Minor divergences: RSI (67) is below its Aug/Sep peak (about 75) and the Oct 23 spike (72) while price is at new highs. CMF has also dropped from 0.256 to 0.125. These are mild warnings, not confirmed reversals.
- Momentum trend: MACD has stayed above its signal line with a rising histogram. ADX has risen from below 20 to above 30, which signals a new trend impulse.
- Crossovers: No bearish crossovers are present. The latest +DI/−DI reading shows bulls reasserting after a −DI uptick on Oct 29 (18.1).
- Price action: Higher highs and higher lows have held since the late-June low near $100, and the Sep high near $165 has been broken.
CHART PATTERNS
- Ascending staircase / rising channel: Price has made consistent higher lows along the EMA 21 and higher highs since the June bottom. This is a trend continuation structure, similar in spirit to the Ascending Triangle (bullish continuation) in the reference diagram.
- Breakout and consolidation: The $160-$166 area (Oct 16 to Oct 28) formed a brief base. The break above it on Oct 23 and the retest and hold suggest a bullish flag-type continuation. A measured move from the flag implies roughly $175-$180.
- Bearish risk (Rising Wedge): The advance since late September could be read as a Bearish Rising Wedge if momentum keeps fading. This is not confirmed, as price remains well above its lower support line.
- Targets: A continuation target of about $175-$182, near the upper Bollinger Band and the next projected extension. A failure targets the $155-$150 zone, near the BB midline and the SMA 50D/EMA 55 cluster.
POTENTIAL SCENARIOS
- Scenario 1: Bullish Trend Continuation — The strong ADX, +DI dominance, and positive MACD and CMF keep price grinding higher along the upper half of the bands. Trigger: a daily close above $170-$174.60 (upper BB) with RSI holding above 60. Target: $175-$182. Invalidation: a daily close below $159.50 (EMA 21). (52% probability)
- Scenario 2: Bearish Pullback / Mean Reversion — Price is stretched from the EMA 21, RSI and CMF are showing mild divergence, and volume is thin. The market corrects toward the middle band and moving average cluster. Trigger: a close below $159.50 with a MACD histogram flip. Target: $150-$155 (BB midline, SMA 50D, EMA 55). Invalidation: a recovery above $168-$170. (33% probability)
- Scenario 3: Neutral Consolidation — Price chops between $158 and $174 as volatility cools and ADX flattens. Trigger: repeated failures at the upper band without a break of the EMA 21. Target: $160-$170. Invalidation: a decisive close outside the $158-$175 range. (15% probability)
PRICE TARGETS
- Target Price: $174.50 (48 days, Dec 19, 2026)
- Expected Range: $152.00 to $183.00 (width $31.00, about 18.4% of current price, consistent with the 30-60 day guidance)
- Key Levels: Support at $159.52 (EMA 21), Resistance at $174.60 (upper Bollinger Band)
OVERALL BIAS
OVERALL BIAS: BULLISH - The fully bullish MA stack, ADX above 30 with +DI far above −DI, a MACD above signal with a widening histogram, and positive CMF all favor trend continuation. The bias is modest because the extension above the EMA 21, the RSI/CMF cooling and thin volume leave a real chance of a pullback toward $155.
This is educational analysis and not financial advice.