ASTS 62-day bearish forecast — Nov 1, 2026
- Bias: Bearish
- Timeframe: 62 days (made Nov 1, 2026, target date Jan 1, 2027)
- Price at analysis: $40.97
- Price target: $37.00
- Expected range: $32.50 – $44.50
- Result: Pending — graded after the close on Jan 1, 2027
Get a free AI analysis of ASTS today
Analysis
TECHNICAL INDICATORS
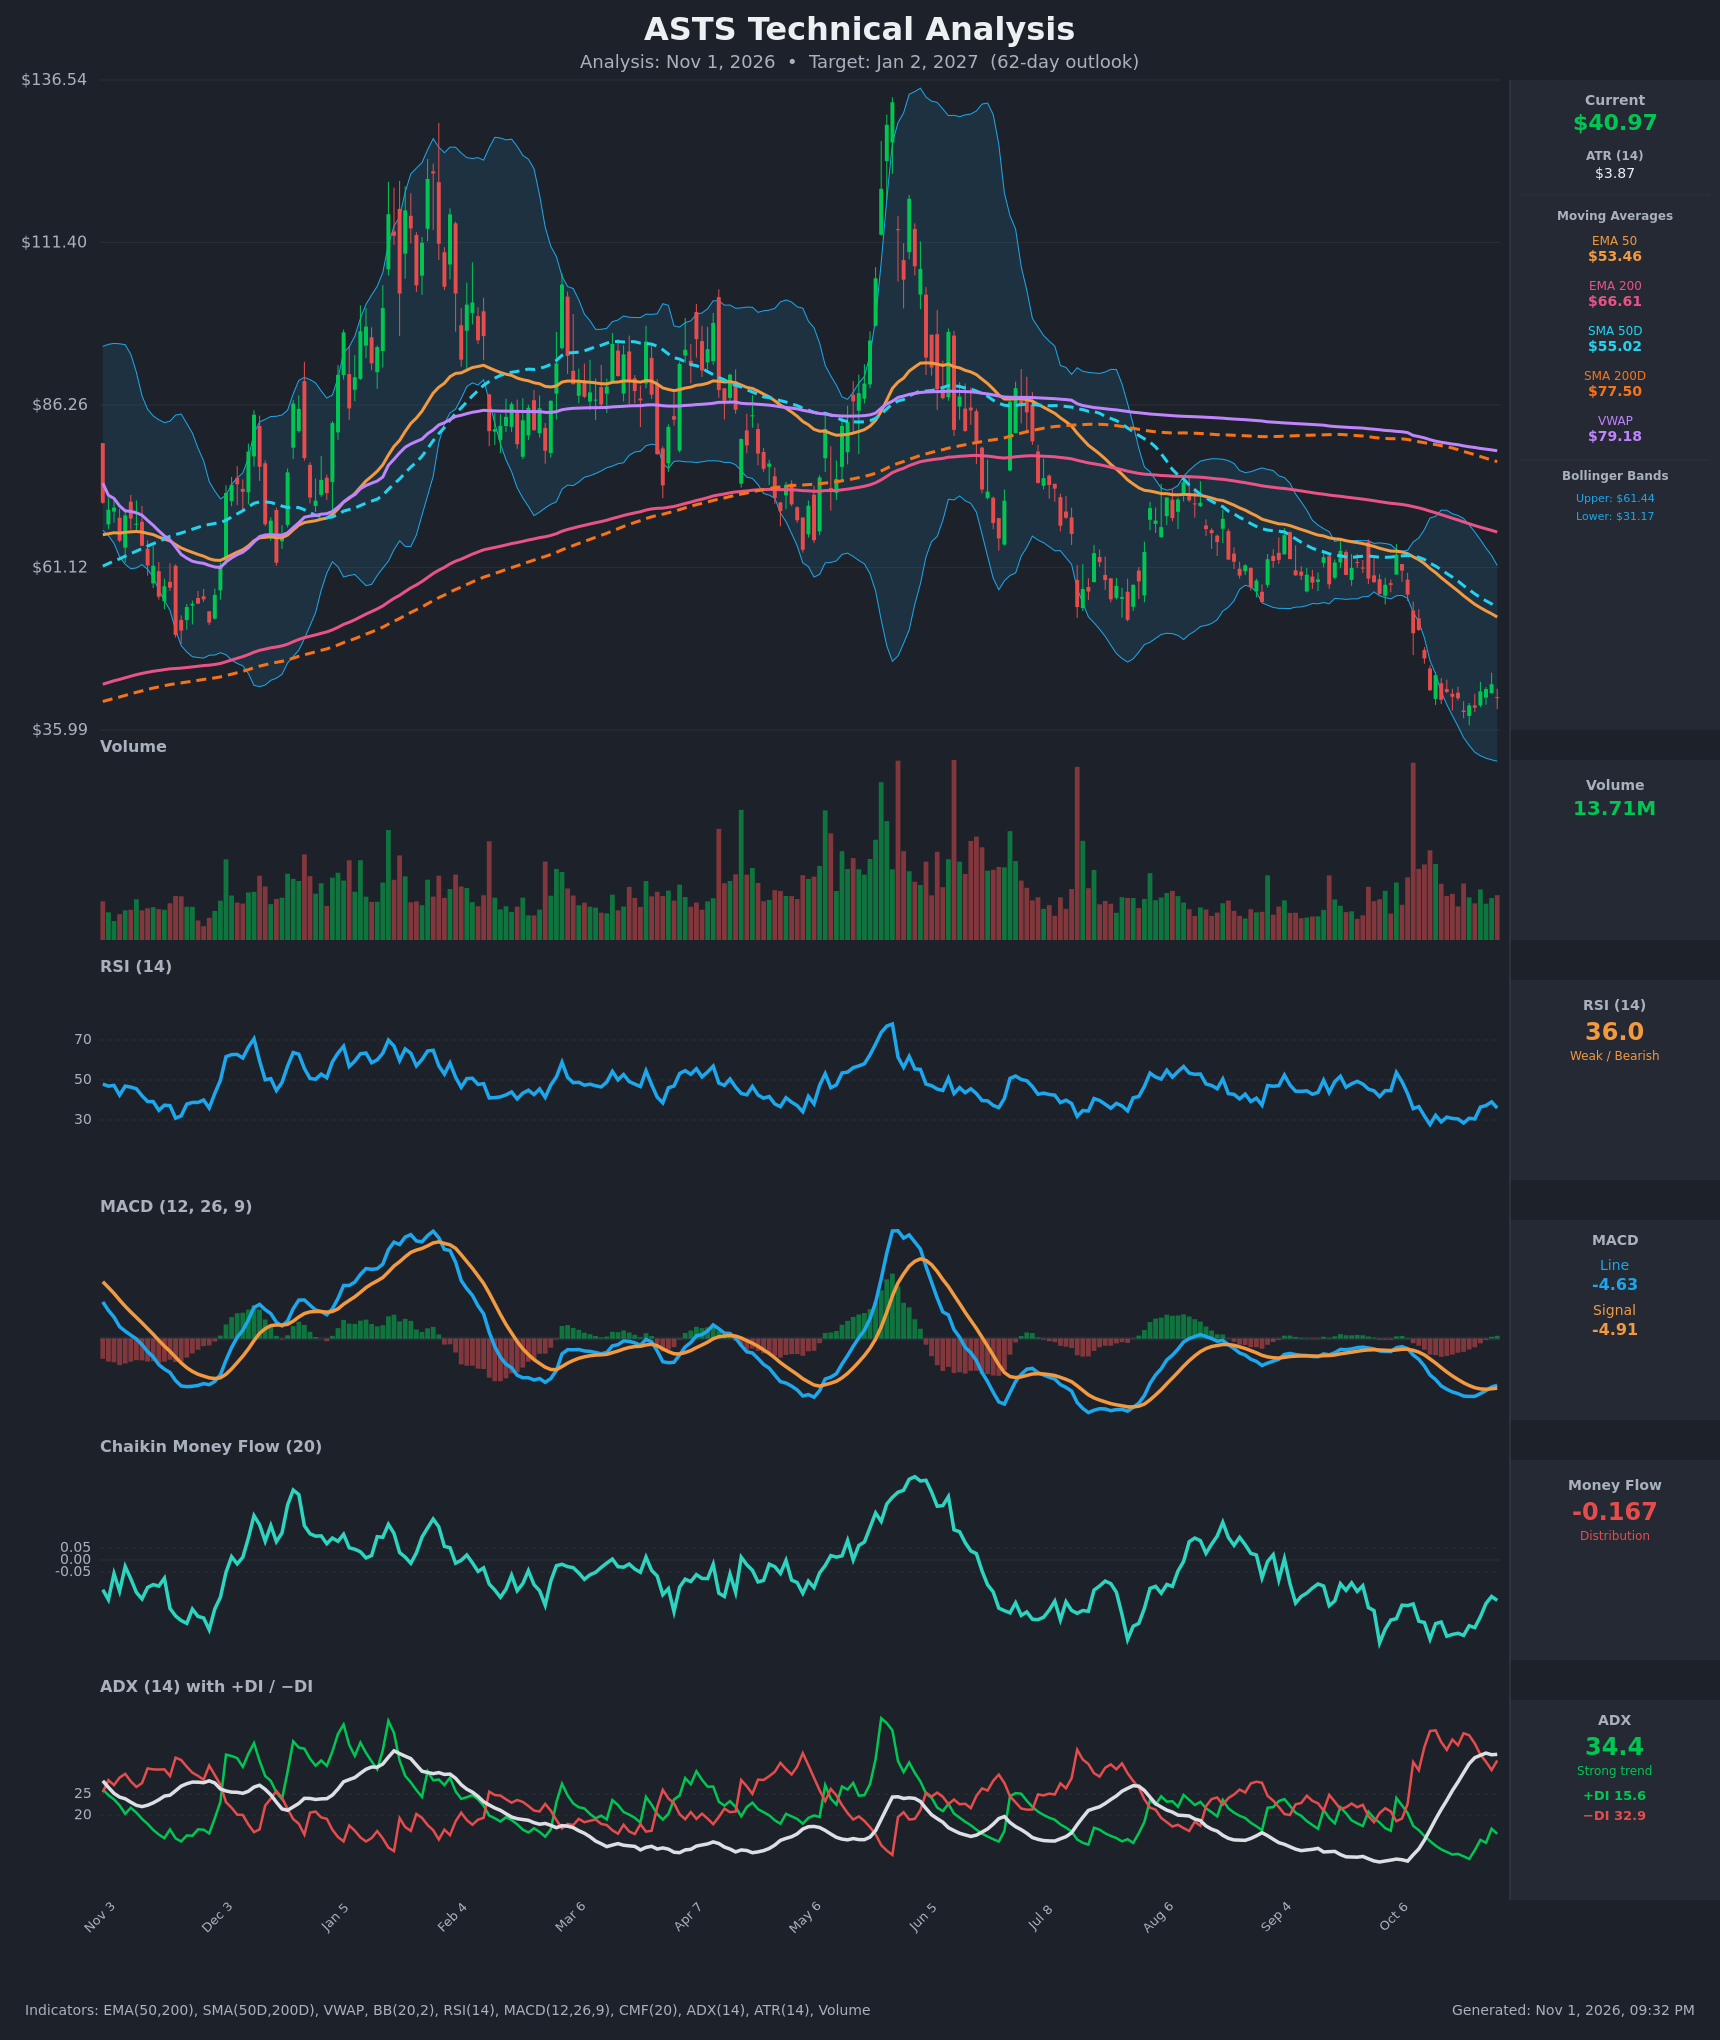
- RSI (14): 35.98, up from a trough near 28 on Oct 14 and 28.5 on Oct 22. Momentum has stabilized but is still below 40 and has made no move toward 50. It bounced to 39.1 on Oct 29 and rolled over to 36.0. [Bearish]
- 20 EMA: The chart shows no 20 EMA, so I use the EMA 50 at $53.46 as the nearest moving average. Price is about 23% below it, and it is falling every day (from $62.34 on Oct 12). It is overhead resistance, and the EMA 200 at $66.61 sits above that. [Bearish]
- MACD: Line -4.63, signal -4.91, so the histogram is slightly positive (+0.27). The line crossed above the signal on Oct 29, but the whole indicator is deep below zero. This is a weak relief crossover, not a trend change. [Neutral]
- Bollinger Bands (20): Upper $61.44, lower $31.17, middle about $46.3. Price at $40.97 is in the lower half of the bands, having walked the lower band during the Oct 13-22 selloff. The bands are wide, so volatility is high. Price has stopped hugging the lower band and is bouncing between about $38.8 and $44.5. [Bearish]
- CMF (20): -0.167, well below -0.05. It improved from -0.327 (Oct 14) to -0.151 (Oct 29), then slipped again. Selling pressure persists, with only mild easing. [Distribution]
- ADX (14): 34.4, rising from 12 two weeks ago, with -DI at 32.9 above +DI at 15.6. This is a strong downtrend. The -DI is off its Oct 15 peak of 40 and +DI is recovering from 9.7, so the trend is maturing and may be losing some force. [Strong Trend – Bearish]
- Volume: 13.71M, roughly in line with recent averages and well below the capitulation spike in mid-October. The selloff peaked on heavy volume (Oct 13-14), and the current bounce is on moderate volume without convincing buying. [Neutral to Bearish]
DIVERGENCES & TRENDS
- Moving average structure: Price is below the EMA 50, EMA 200, SMA 50D, SMA 200D and VWAP ($79.18). The SMA 50D ($55.02) is far below the SMA 200D ($77.50), so the death cross is in place. The EMA 50 is also below the EMA 200. All averages are still falling, so this is a confirmed long-term downtrend.
- Mild bullish divergence: Price made lower lows on Oct 22 ($38.77) and Oct 26 ($39.45) while RSI held near 28-30 and MACD histogram turned up. This suggests selling momentum is fading, but it needs a close above $44.50 to matter.
- MACD: The bullish crossover on Oct 29 happened far below the zero line. In a strong downtrend (ADX 34), these crossovers often fail.
- ADX/DI: -DI has fallen from 40 to 32.9 and +DI has risen from 9.7 to 15.6. The DIs are converging, but -DI still dominates.
- CMF: It has been negative for months, with no sustained accumulation since June.
CHART PATTERNS
- Primary: Bearish Flag / Rectangle Continuation. After the sharp drop from about $60 to $39, price has consolidated in a tight $38.8-$44.5 range. In the reference diagram, a breakdown from this kind of consolidation projects a measured move. The pole is about $20, so a breakdown below $38 points toward the mid-$30s and the lower Bollinger Band area near $31.
- Secondary: Possible Bullish Double Bottom. Lows near $38.77 and $39.45 form a shallow double bottom with the neckline near $44.50. A close above that level, with rising volume and RSI above 45, would turn this into a reversal and target about $50-53 (EMA 50). It is not confirmed.
- Larger structure: A series of lower highs from about $130 to $60 and now $44 forms a Descending Triangle / broad downtrend that favors the bears.
POTENTIAL SCENARIOS
- Scenario 1: Bearish Trend Continuation — The consolidation resolves lower as the dominant downtrend (ADX 34, -DI far above +DI, CMF negative, price below every MA) reasserts itself. Rallies stall near the falling EMA 50 or the $44.50 resistance. Trigger: Daily close below $38.50 on rising volume. Target: $33-$37, with a possible tag of the lower band near $31. Invalidation: Close above $44.50 with RSI above 45. (50% probability)
- Scenario 2: Bullish Relief Reversal — The MACD crossover, bullish RSI divergence and double-bottom structure lead to a bounce toward the declining EMA 50. Trigger: Close above $44.50 and the Bollinger midline (~$46). Target: $50-$53. Invalidation: Close below $38.50. (33% probability)
- Scenario 3: Neutral Range Consolidation — Price chops between $38 and $45 for most of the period as volatility compresses. Trigger: Failure to break either $38.50 or $44.50. Target: $39-$44. Invalidation: A daily close outside the range on strong volume. (17% probability)
PRICE TARGETS
- Target Price: $37.00 (62 days)
- Expected Range: $32.50 to $44.50 (width $12.00, about 29% of the current price, in line with the 61-180 day guidance)
- Key Levels: Support at $38.50, Resistance at $44.50
OVERALL BIAS
OVERALL BIAS: BEARISH - Price is below all major moving averages with a death cross in place, ADX at 34 with -DI dominant, and CMF at -0.167 showing persistent distribution. The MACD crossover and RSI stabilization are weak, sub-zero relief signals that have not yet broken resistance at $44.50. The consolidation looks more like a bearish continuation than a base.
This is educational analysis and not financial advice.