META 62-day bearish forecast — Nov 1, 2026
- Bias: Bearish
- Timeframe: 62 days (made Nov 1, 2026, target date Jan 1, 2027)
- Price at analysis: $614.99
- Price target: $596.00
- Expected range: $525.00 – $690.00
- Result: Pending — graded after the close on Jan 1, 2027
Get a free AI analysis of META today
Analysis
TECHNICAL INDICATORS
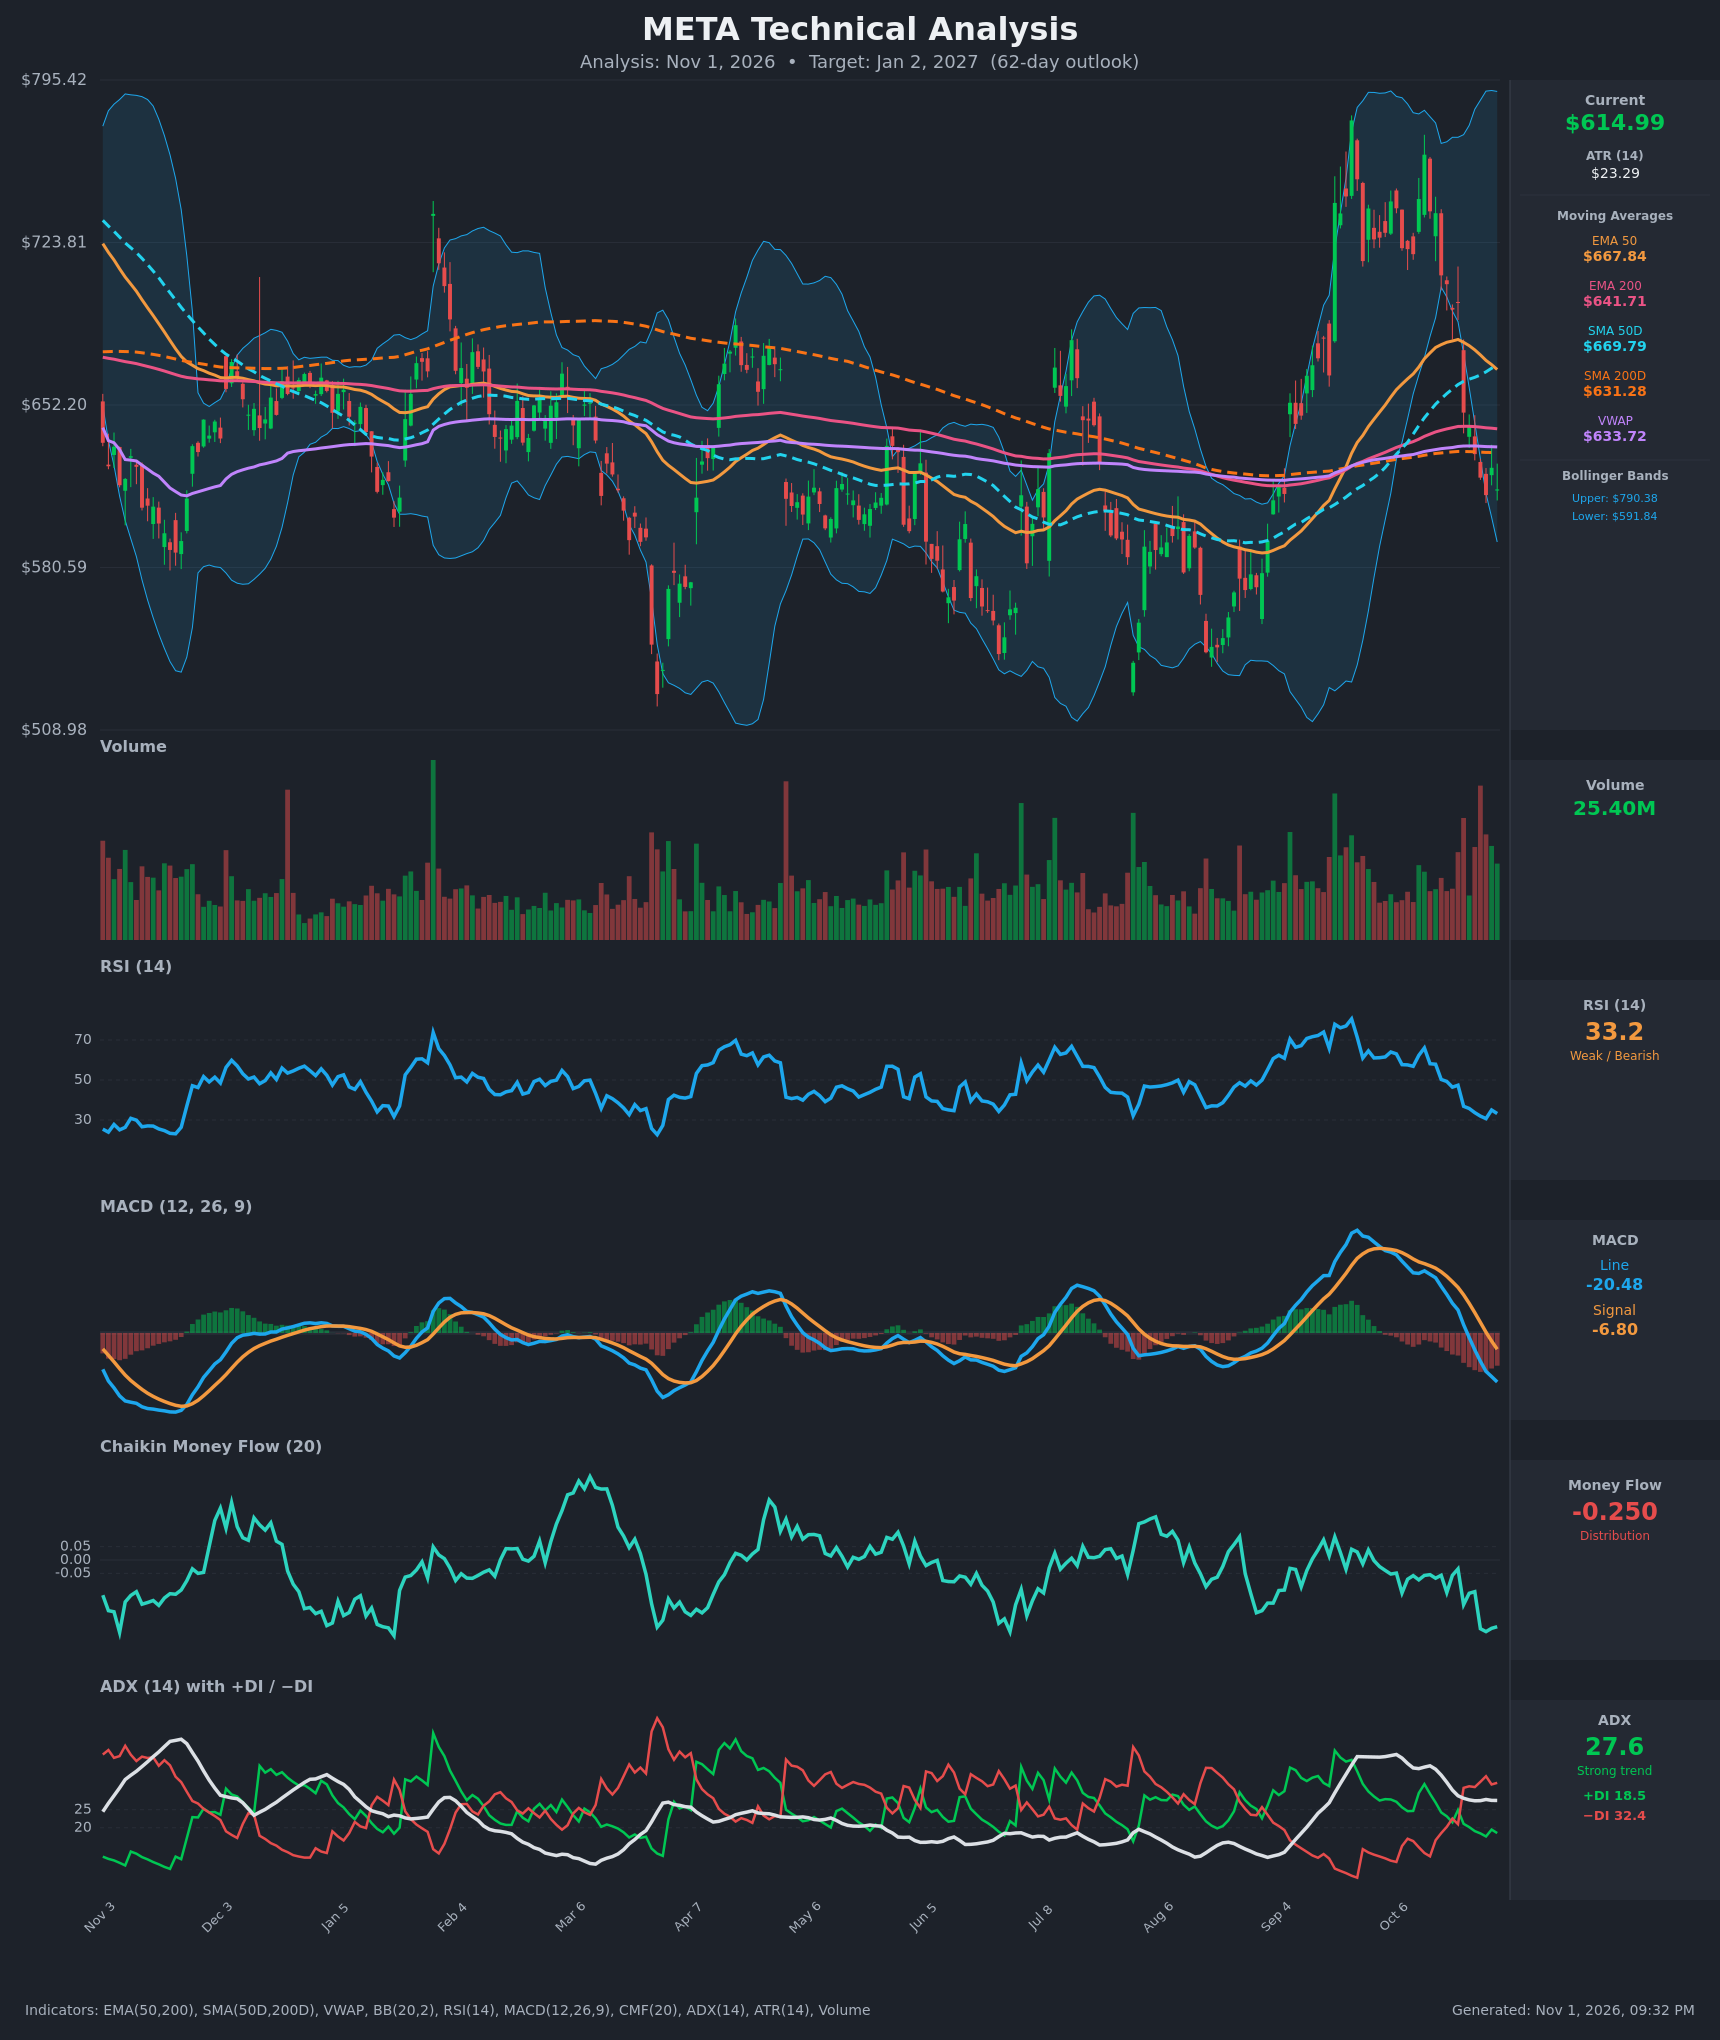
- RSI (14): 33.23, down from ~66 on Oct 13 and sitting just above the 30 oversold line. It bounced briefly to 35 on Oct 29 and rolled over again. Momentum is weak but approaching oversold, where a bounce is possible. [Bearish]
- 20 EMA: No 20 EMA value was supplied. Price at $614.99 is well below the EMA 50 ($667.84) and EMA 200 ($641.71), and the short-term average is clearly sloping down after the drop from ~$762. Overhead averages act as resistance. [Bearish]
- MACD: Line at -20.48 is below signal at -6.80, with a bearish crossover on Oct 28. The histogram is negative (about -13.7) and widening, and the line is falling steeply from +25 in mid-October. [Bearish]
- Bollinger Bands (20): Price is near the lower band ($591.84), about 1 ATR above it. The bands are very wide (upper $790.38), reflecting high volatility after the September-October spike. Price is in the lower part of the range, so a bounce is possible, but the band-walk is bearish. [Bearish]
- CMF (20): -0.250, deep in distribution and near the lowest readings on the chart. It has been persistently negative, so sellers are active on the decline. [Distribution]
- ADX (14): 27.6 with −DI (32.4) well above +DI (18.5). The −DI crossover happened Oct 22, and ADX is above 25. This is a strong downtrend, though ADX is flattening at 27.5–27.8, so the trend is no longer accelerating. [Strong Trend – Bearish]
- Volume: 25.40M, elevated relative to the quiet mid-year bars. Recent heavy volume sits on red down bars, which points to distribution; the last bar is green but small. [Bearish – selling pressure with a hint of capitulation]
DIVERGENCES & TRENDS
- No bullish RSI/price divergence yet. RSI and MACD are both making lower lows alongside price.
- Price fell from ~$762 (Oct 13) to ~$613 (Oct 28), about -20% in two weeks. It briefly bounced to $624.52 and has since rolled back to $614.99.
- The EMA 50 ($667.84) is falling and converging toward the EMA 200 ($641.71). A bearish EMA cross is likely within weeks. SMA50 ($669.79) remains above SMA200 ($631.28), so no death cross yet, but the gap is narrowing.
- Price is below every moving average (EMA 50, EMA 200, SMA 50, SMA 200, VWAP at $633.72). It has lost the SMA200 (~$631), which was the support floor from August to October.
- A bearish MACD crossover and a −DI over +DI crossover have both been confirmed.
- Historical context: RSI near 30 has marked several swing lows (Mar, Aug), followed by relief rallies. The lower band and the $580–$590 area have held before.
CHART PATTERNS
- The September-October rally followed by a sharp reversal resembles a Bearish Head and Shoulders / Double Top formation near $740–$760. The highs at ~$762 and ~$740 (Oct 13–14) failed, and price broke the "neckline" around $650–$660 (the Oct 22 breakdown). The measured move from the ~$760 top to a ~$650 neckline is ~$110, which projects to ~$540.
- A Bearish Pennant/Flag is not clearly formed. The tight consolidation near $612–$625 could become a small base or a continuation flag.
- The longer-term range of $540–$720 remains intact. Price is now in the lower-middle of that range with support at $580–$590 and the Aug low of ~$540–$550.
POTENTIAL SCENARIOS
- Scenario 1: Bearish Continuation Toward Range Lows — The H&S/double-top breakdown, −DI dominance and heavy distribution (CMF -0.25) pull price below the lower Bollinger Band. Trigger: daily close below $591 (lower band) and $580. Target: $545–$570. Invalidation: close back above $650 (the breakdown level and EMA 200 area). (45% probability)
- Scenario 2: Bullish Oversold Relief Bounce — RSI near 30 and a test of the lower band produce a mean-reversion bounce toward the SMA200/VWAP area and the EMA 200, then stall under the declining EMA 50. Trigger: reclaim of $634 (VWAP) with a bullish RSI divergence. Target: $650–$665. Invalidation: close below $585. (35% probability)
- Scenario 3: Neutral Range Consolidation — Price chops between $585 and $650 as ADX fades from 27. Trigger: sideways closes within the range with declining volume. Target: $600–$635. Invalidation: close outside $580–$655. (20% probability)
PRICE TARGETS
- Target Price: $596.00 (62-day, a modest decline from the current $614.99, as the downtrend is likely to extend but with oversold bounces along the way)
- Expected Range: $525.00 to $690.00 (width $165, or ~26.8% of the current price, in line with the 18–30% guidance for 61–180 days)
- Key Levels: Support at $591.84 (lower Bollinger Band; next at ~$550), Resistance at $633.72 (VWAP/SMA200 zone, then $641.71 EMA 200)
OVERALL BIAS
OVERALL BIAS: BEARISH - Price is below all key moving averages with a confirmed bearish MACD crossover, −DI far above +DI with ADX above 25, and persistent distribution (CMF -0.25). Oversold RSI near 30 argues for bounces, but the trend and the broken-neckline structure favor a lower target over the 62-day window.
This is educational analysis and not financial advice.