INTC 62-day bearish forecast — Nov 1, 2026
- Bias: Bearish
- Timeframe: 62 days (made Nov 1, 2026, target date Jan 1, 2027)
- Price at analysis: $65.76
- Price target: $61.50
- Expected range: $52.50 – $72.00
- Result: Pending — graded after the close on Jan 1, 2027
Get a free AI analysis of INTC today
Analysis
TECHNICAL INDICATORS
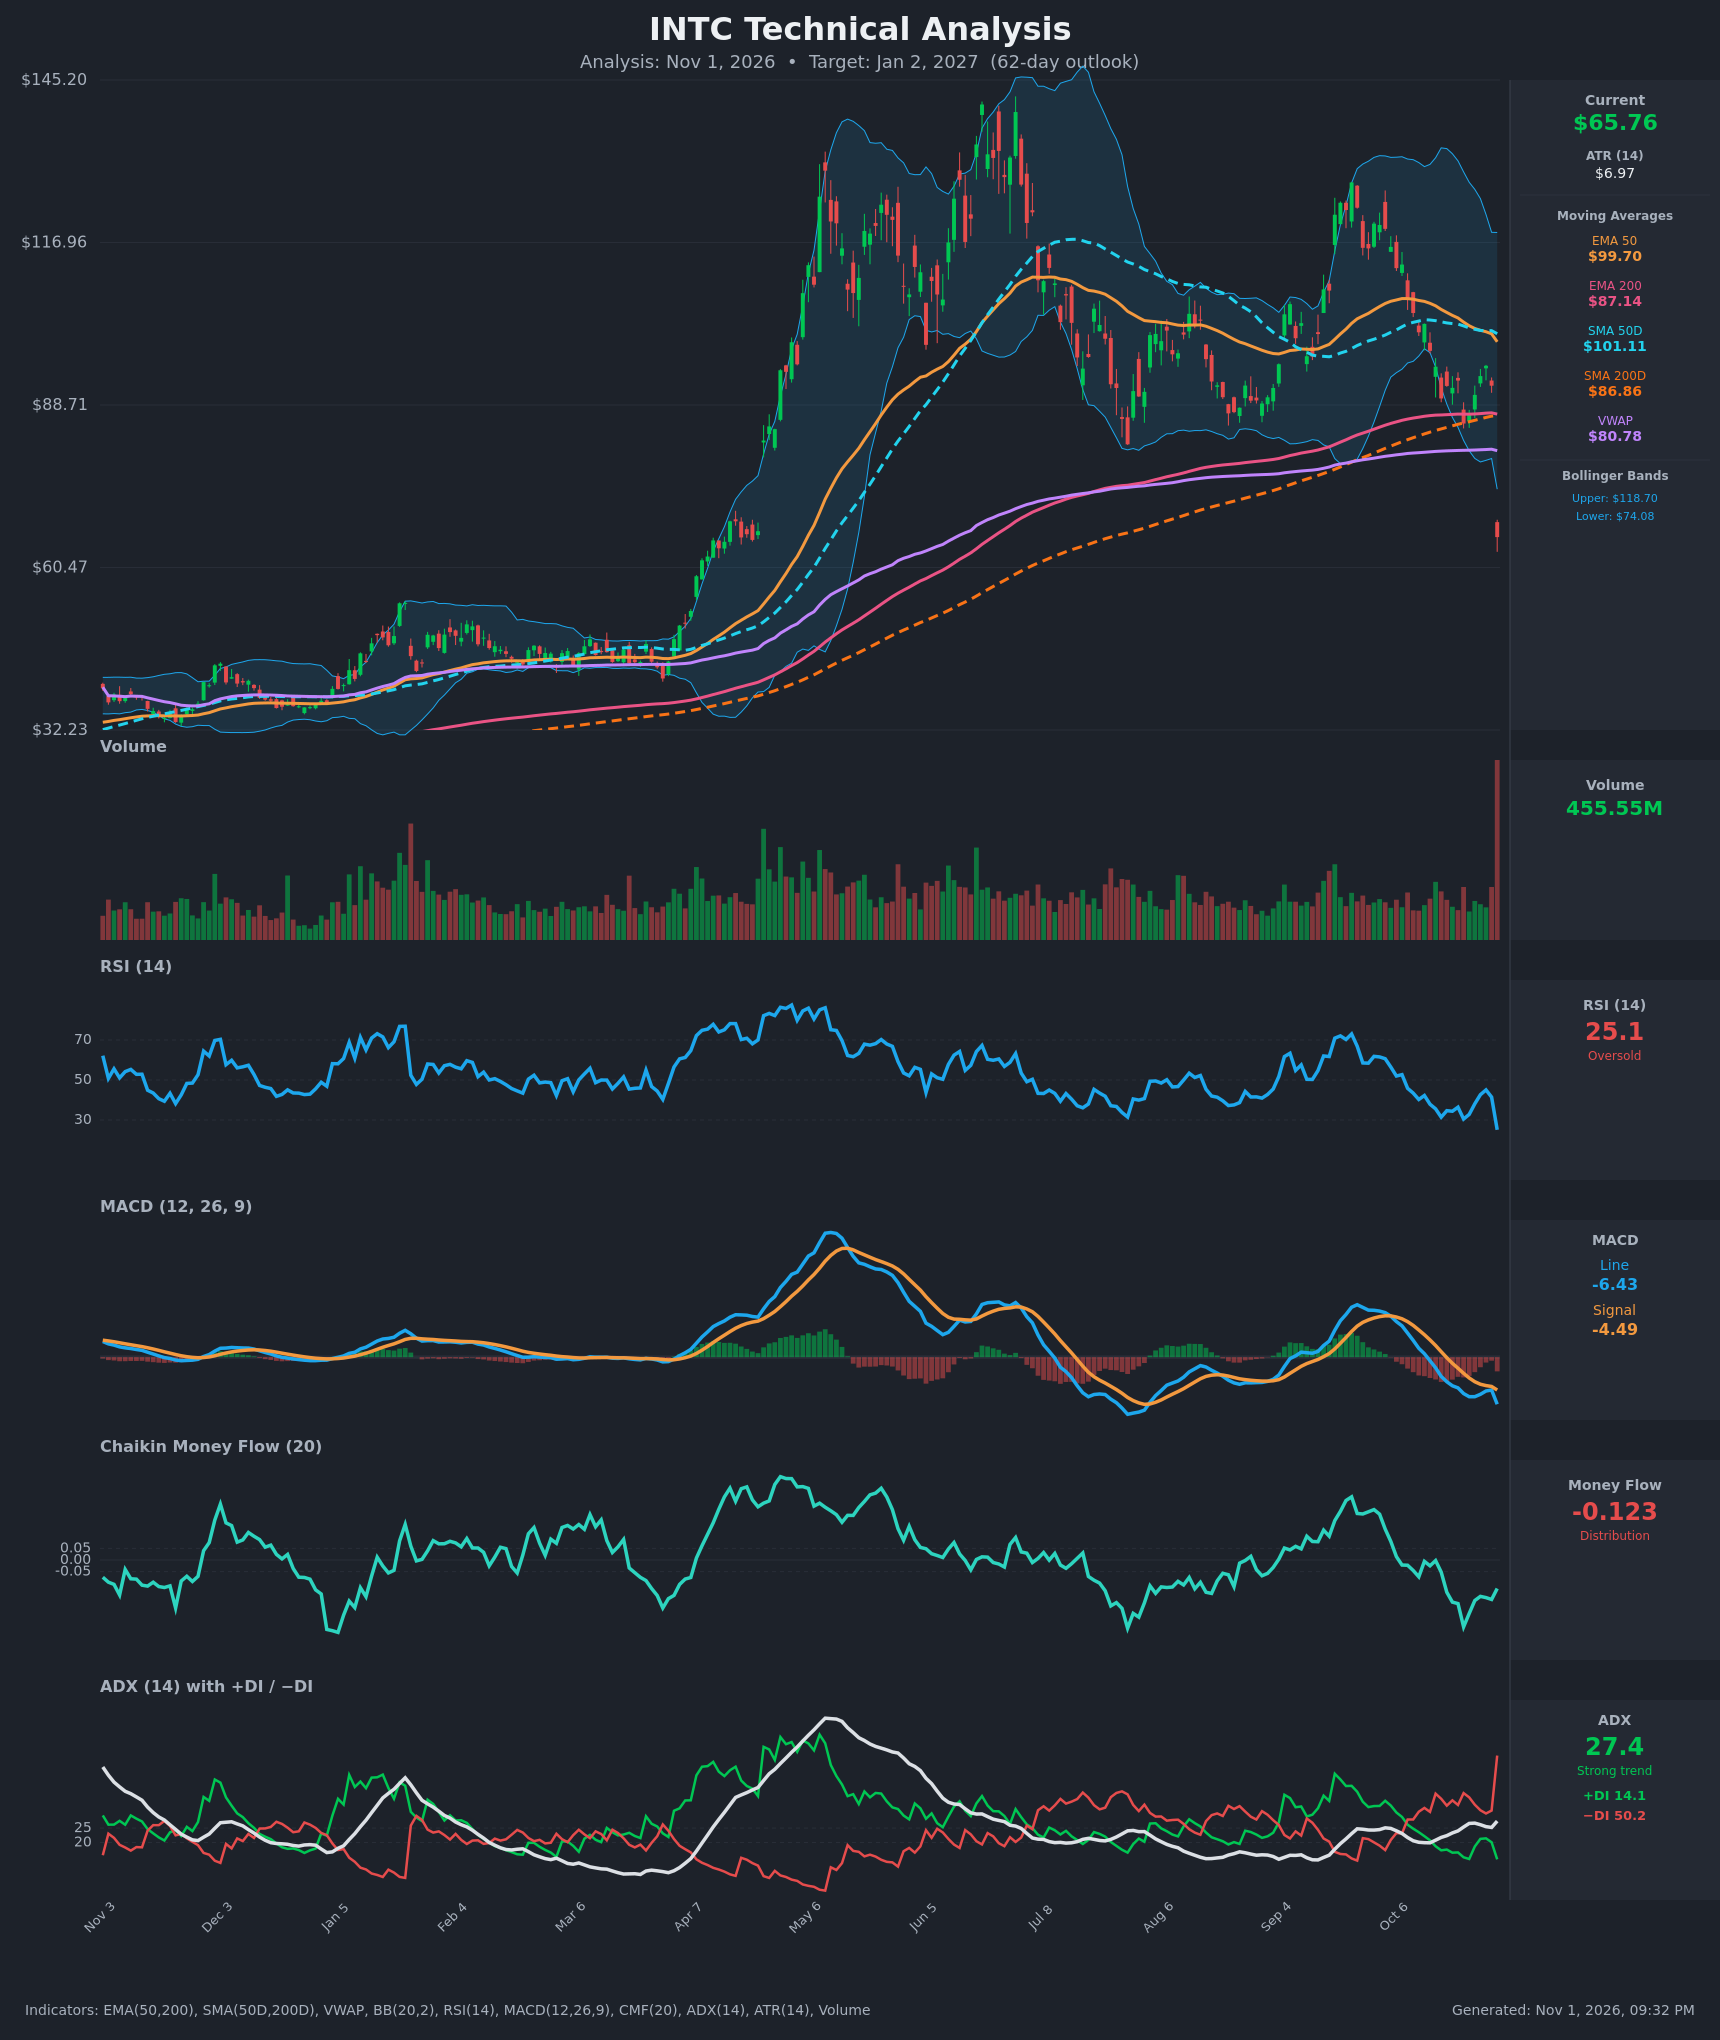
- RSI (14): 25.1, oversold and down from 41.5 the day before. Momentum is sharply negative, and the oversold reading raises the odds of a relief bounce but does not signal a reversal on its own. [Bearish]
- 20 EMA: The 20 EMA was not provided, so the EMA 50 at $99.70 is the proxy. Price sits about 34% below it, and the EMA 50 is rolling over (from $106.9 on Oct 12). It is far overhead resistance. EMA 50 is still above EMA 200 ($87.14), but the gap has shrunk from about $20 to about $12.6. [Bearish]
- MACD: Line -6.43 is below signal -4.49. It crossed bearish around Oct 19 and the histogram (about -1.94) is widening, so downside momentum is accelerating. [Bearish]
- Bollinger Bands (20): Price at $65.76 is about $8.3 below the lower band ($74.08), roughly 3.8 ATR below the prior close. The bands are wide (upper $118.70), so volatility is elevated. The close outside the band shows a violent breakdown, and it raises the chance of a mean-reversion bounce toward the lower band. [Bearish]
- CMF (20): -0.123, below the -0.05 threshold. It has been negative for several weeks, which means persistent distribution. [Distribution]
- ADX (14): 27.4 and rising, with -DI at 50.2 far above +DI at 14.1. Sellers are firmly in control of a strong downtrend. [Strong Trend – Bearish]
- Volume: 455.55M, by far the largest bar on the chart. It came with a roughly 28.6% one-day gap down, which points to heavy institutional liquidation or a news and earnings shock rather than routine selling. [Bearish – capitulation-type volume]
DIVERGENCES & TRENDS
- There is no bullish RSI or MACD divergence. RSI made a new low (25.1) alongside a new price low, so momentum confirms the price move.
- Price is far below VWAP ($80.78), SMA 200D ($86.87) and EMA 200 ($87.14). It lost all of them in one session, which turns the long-term trend structure bearish.
- A death cross (SMA 50D $101.11 below SMA 200D $86.87) has not happened yet, but the spread is narrowing and the cross is likely within the horizon.
- MACD crossed down on Oct 19 and has been deepening. The recent bounce to $95.53 on Oct 28 failed beneath the falling EMA 50 and SMA 50D.
- -DI jumped from 31 to 50 in one bar and ADX is back above 25, so the trend is re-strengthening.
- CMF has been sustained negative since mid-September, which warned of the breakdown.
CHART PATTERNS
- Bearish Double Top (macro): Peaks near $140 in May and a lower high near $128 in September, with a neckline around $85–88 (the Aug–Oct lows). The gap to $65.76 breaks that neckline decisively. The textbook measured move is about $54 below the neckline (to the low $30s). That is well beyond 62 days, but it shows the downside risk. The old Mar–Apr consolidation near $45–50 is a longer-term magnet.
- Bearish Expanding Triangle / lower-high structure (Jun–Oct): The sideways, widening range between about $85 and $128 resolved to the downside.
- Gap breakdown: The gap sits near the April–May breakout zone ($60–70), which should act as support. The gap-fill area is $74–$90, and any bounce into it is likely to meet heavy overhead supply.
POTENTIAL SCENARIOS
- Scenario 1: Bearish Continuation / Post-Shock Drift Lower — Sellers keep control (-DI 50, ADX rising). A weak oversold bounce fades near the lower Bollinger Band and VWAP, and price retests and slices through the $60 support zone. Trigger: a failed bounce below $74 or a daily close below $60.47. Target: $55–$60, with a stretch toward $52. Invalidation: a daily close above $80.78 (VWAP). (50% probability)
- Scenario 2: Neutral Basing Range After Capitulation — The record volume marks an exhaustion low. Price bases between about $58 and $74 as RSI resets and the bands contract. Trigger: higher lows above $60 with MACD histogram flattening. Target: $62–$70. Invalidation: a close below $58 or above $76. (25% probability)
- Scenario 3: Bullish Relief Rally / Partial Gap Fill — A sharp oversold reversal fills part of the gap into the $76–$82 zone (lower BB, VWAP). Trigger: a close above $74.08 with RSI back above 40 and CMF turning positive. Target: $76–$82. Invalidation: a failure to hold $65, or a close back below $60. (25% probability)
PRICE TARGETS
- Target Price: $61.50 (62-day, Jan 2, 2027)
- Expected Range: $52.50 to $72.00 (width $19.50, about 29.7% of current price, consistent with the 61–180 day guidance)
- Key Levels: Support at $60.47, Resistance at $74.08
OVERALL BIAS
OVERALL BIAS: BEARISH - A heavy-volume gap breakdown through every major moving average, MACD still deepening, -DI at 50 with ADX above 25, and CMF in distribution all favor continuation lower. The oversold RSI argues for a relief bounce first, but that bounce is likely to meet heavy overhead supply at $74–$81.
This is educational analysis and not financial advice.