MU 62-day bearish forecast — Nov 1, 2026
- Bias: Bearish
- Timeframe: 62 days (made Nov 1, 2026, target date Jan 1, 2027)
- Price at analysis: $884.74
- Price target: $830.00
- Expected range: $725.00 – $950.00
- Result: Pending — graded after the close on Jan 1, 2027
Get a free AI analysis of MU today
Analysis
TECHNICAL INDICATORS
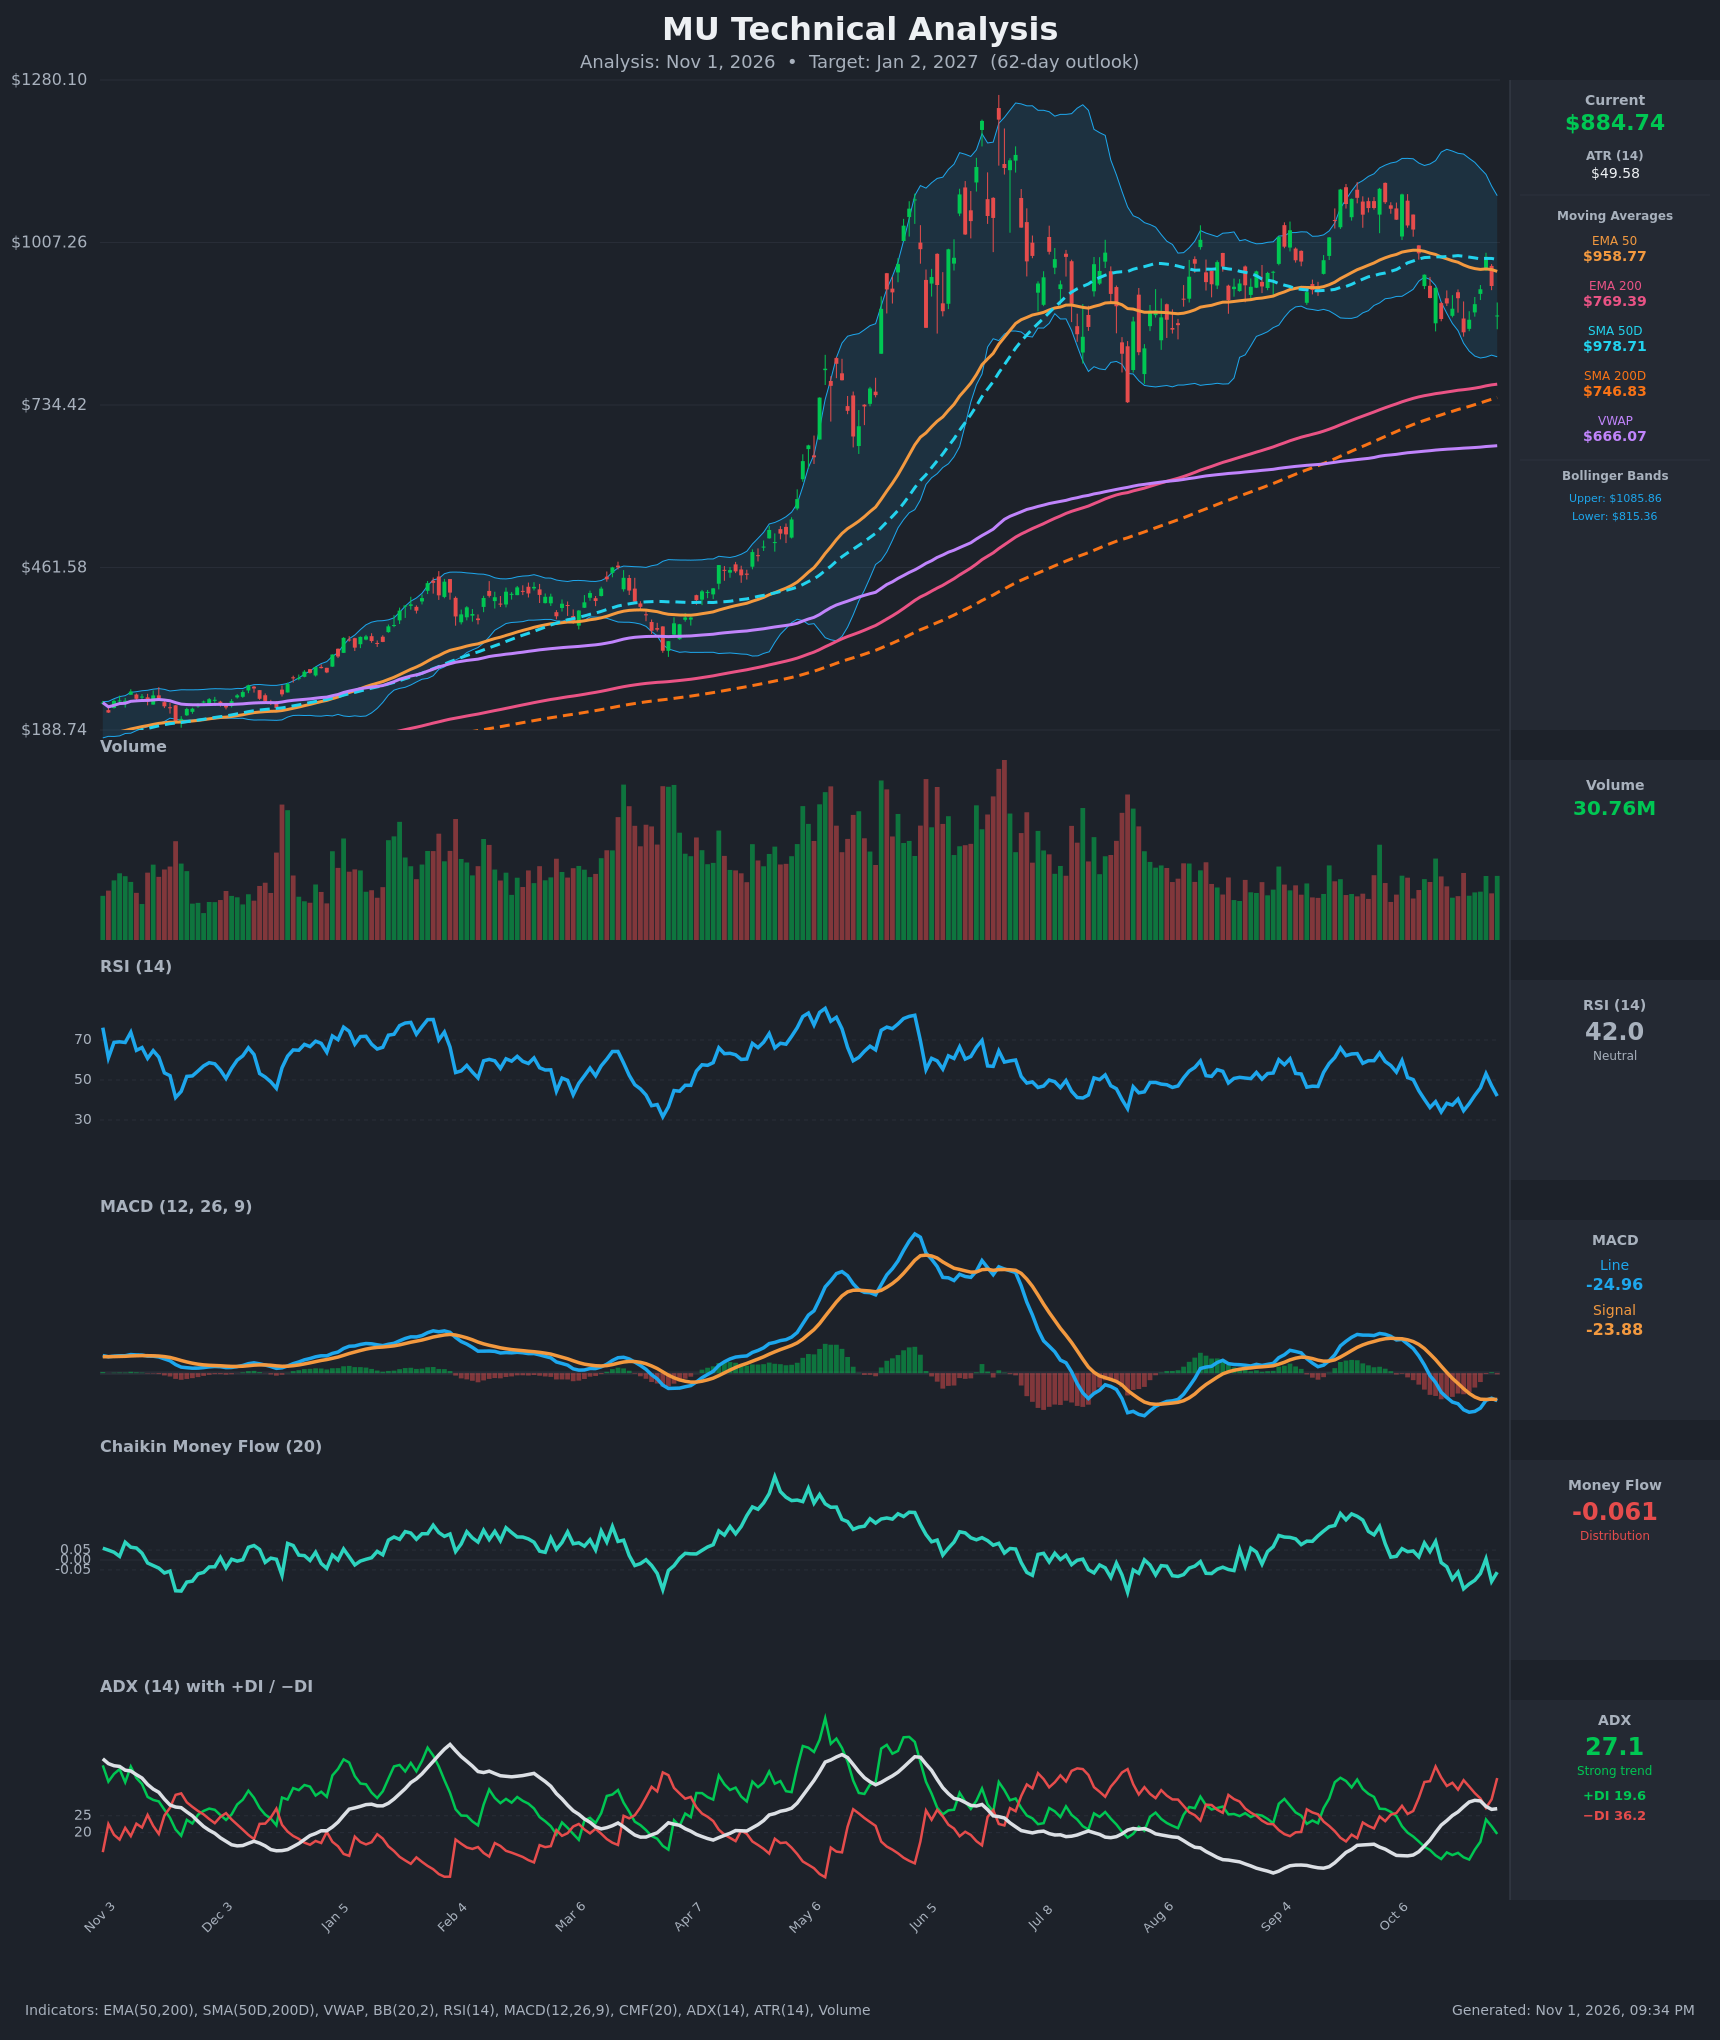
- RSI (14): 41.98, below the 50 midline and well off the Oct 28 spike to 53.2. RSI has made lower highs since the summer (peaks near 60-65) and is not yet oversold (<30). Momentum is soft with room to fall. [Bearish]
- 20 EMA: The 20 EMA is not supplied, so I use the EMA 50 at $958.77 as the nearest trend average. Price ($884.74) is about 7.7% below it, and the EMA 50 is sloping down from ~$994 on Oct 12. It acts as overhead resistance. [Bearish]
- MACD: Line -24.96 vs signal -23.88, a histogram of about -1.1. The line fell from +15.7 (Oct 12) to -35.4 (Oct 23), briefly neared the signal on Oct 28-29, and has rolled over again. MACD is below zero and below its signal, so momentum is negative, though the shallow histogram suggests selling is not accelerating. [Bearish]
- Bollinger Bands (20): Upper $1085.86, lower $815.36, middle about $950. Price sits in the lower third of the bands, about 2.6% from the lower band. The wide bands show elevated volatility, and the Oct 12-22 slide hugged the lower half. A pullback to the lower band is plausible, but there is no squeeze or reversal signal yet. [Bearish]
- CMF (20): -0.061, below the -0.05 threshold. It has been mostly negative since Oct 16 apart from a brief blip to +0.006 on Oct 28 (low of -0.145 on Oct 22). Sustained mild distribution. [Distribution]
- ADX (14): 27.1 and rising from 14.3 on Oct 12. −DI (36.2) is far above +DI (19.6), a gap of about 17 points. This is a strong, established downtrend over the recent weeks. [Strong Trend – Bearish]
- Volume: 30.76M, in the lower half of the year's range and well below the heavy spring and summer volume. The latest pullback is not on capitulation volume, so there is no washout, and no strong dip-buying volume either. [Neutral to mildly Bearish – no capitulation, no accumulation]
DIVERGENCES & TRENDS
- No bullish divergence: price made a lower low on Oct 22 ($856.49), while RSI (34.7) was near its Oct 16 low (34.0). That is only a mild, non-confirmed hint of stabilization. RSI's failure to reach 60+ on rallies shows weakening momentum relative to the spring uptrend.
- Moving averages: the 50 EMA and SMA 50 are rolling over (EMA 50 has fallen from $994 to $959), while the 200s are still rising (EMA 200 $769, SMA 200D $747). The SMA 50D ($978.71) sits well above the SMA 200D, so there is no death cross. The long-term structure is still an uptrend, but the gap between short and long averages is narrowing.
- Price vs long-term trend: price is about 18% above the SMA 200D and about 15% above the EMA 200. That is still a bull-market structure, but price is 33% above VWAP ($666), so it is extended relative to the cumulative average.
- Trend direction: the ADX/DI shift (+DI falling from ~24 on Oct 28 to 19.6, −DI up to 36.2) shows bears regaining control after the failed bounce to $983. Price was rejected at the SMA 50/EMA 50 zone (~$960-$985).
- Crossovers: the MACD line is below its signal and below zero. The Oct 28 bounce failed to produce a bullish MACD crossover, which is a negative sign.
CHART PATTERNS
- Bearish distribution after a blow-off top: price peaked near $1,260 in June, then formed a lower high (~$1,050-$1,100) in Sep-Oct. This resembles a Bearish Double Top / lower-high topping structure, though it is not a textbook match. The "neckline" is the July swing low near $734 and the $735-$770 zone, where the EMA 200 and SMA 200D converge.
- Recent action: the Oct breakdown from the Aug-Oct range (~$900-$1,050) resembles a failed bullish flag or a breakdown from a rectangle/range. The Oct 28 bounce to $983 was rejected at the 50-day averages.
- Targets: a measured move toward the $735-$770 zone is the bearish target. A break below it would expose $650-$700 (the VWAP is near $666).
- Bullish counter-case: if price reclaims ~$960-$985 on strong volume, the structure could instead read as a broad consolidation range (rectangle) within the larger uptrend, with a retest of $1,050+.
POTENTIAL SCENARIOS
- Scenario 1: Bearish Grind to the 200-Day Zone — Selling continues with −DI dominant and the MACD staying negative. Price breaks the lower Bollinger Band area and tests the EMA 200/SMA 200D confluence. Trigger: close below $815 (the lower Bollinger Band) with CMF staying below -0.05. Target: $770-$735 (EMA 200, then the July low), with an overshoot to ~$730. Invalidation: daily close above $960 (the EMA 50) with MACD crossing up. (48% probability)
- Scenario 2: Neutral Range Chop — Price oscillates between the lower Bollinger Band (~$815) and the 50-day averages (~$960-$980), as in the Aug-Oct pattern. Trigger: RSI holding 38-55 and ADX fading below 25. Target: $850-$930. Invalidation: close outside $800-$985. (27% probability)
- Scenario 3: Bullish Reclaim of the 50s — Dip buyers defend $815-$856 (the Oct 22 low), RSI turns up, and MACD crosses bullishly. Trigger: close above $985 with volume expansion. Target: $1,040-$1,085 (the upper Bollinger Band). Invalidation: close back below $856. (25% probability)
PRICE TARGETS
- Target Price: $830.00 (62-day target, Jan 2, 2027)
- Expected Range: $725.00 to $950.00 (width $225, about 25.4% of current price, consistent with the 18-30% guidance for 61-180 days)
- Key Levels: Support at $815.36 (lower Bollinger Band; then $769.39 EMA 200 and $734 July low), Resistance at $958.77 (EMA 50; then $978.71 SMA 50D and $983 recent high)
OVERALL BIAS
OVERALL BIAS: BEARISH - Price is below its 50-day averages with −DI (36.2) far above +DI (19.6) at ADX 27, MACD is negative and below its signal, CMF shows distribution, and RSI keeps making lower highs. The long-term averages (EMA 200 ~$769, SMA 200D ~$747) are the likely magnet, while the intact long-term uptrend limits downside conviction.
This is educational analysis and not financial advice.