USO 62-day bullish forecast — Nov 1, 2026
- Bias: Bullish
- Timeframe: 62 days (made Nov 1, 2026, target date Jan 1, 2027)
- Price at analysis: $168.83
- Price target: $177.00
- Expected range: $153.00 – $193.00
- Result: Pending — graded after the close on Jan 1, 2027
Get a free AI analysis of USO today
Analysis
TECHNICAL INDICATORS
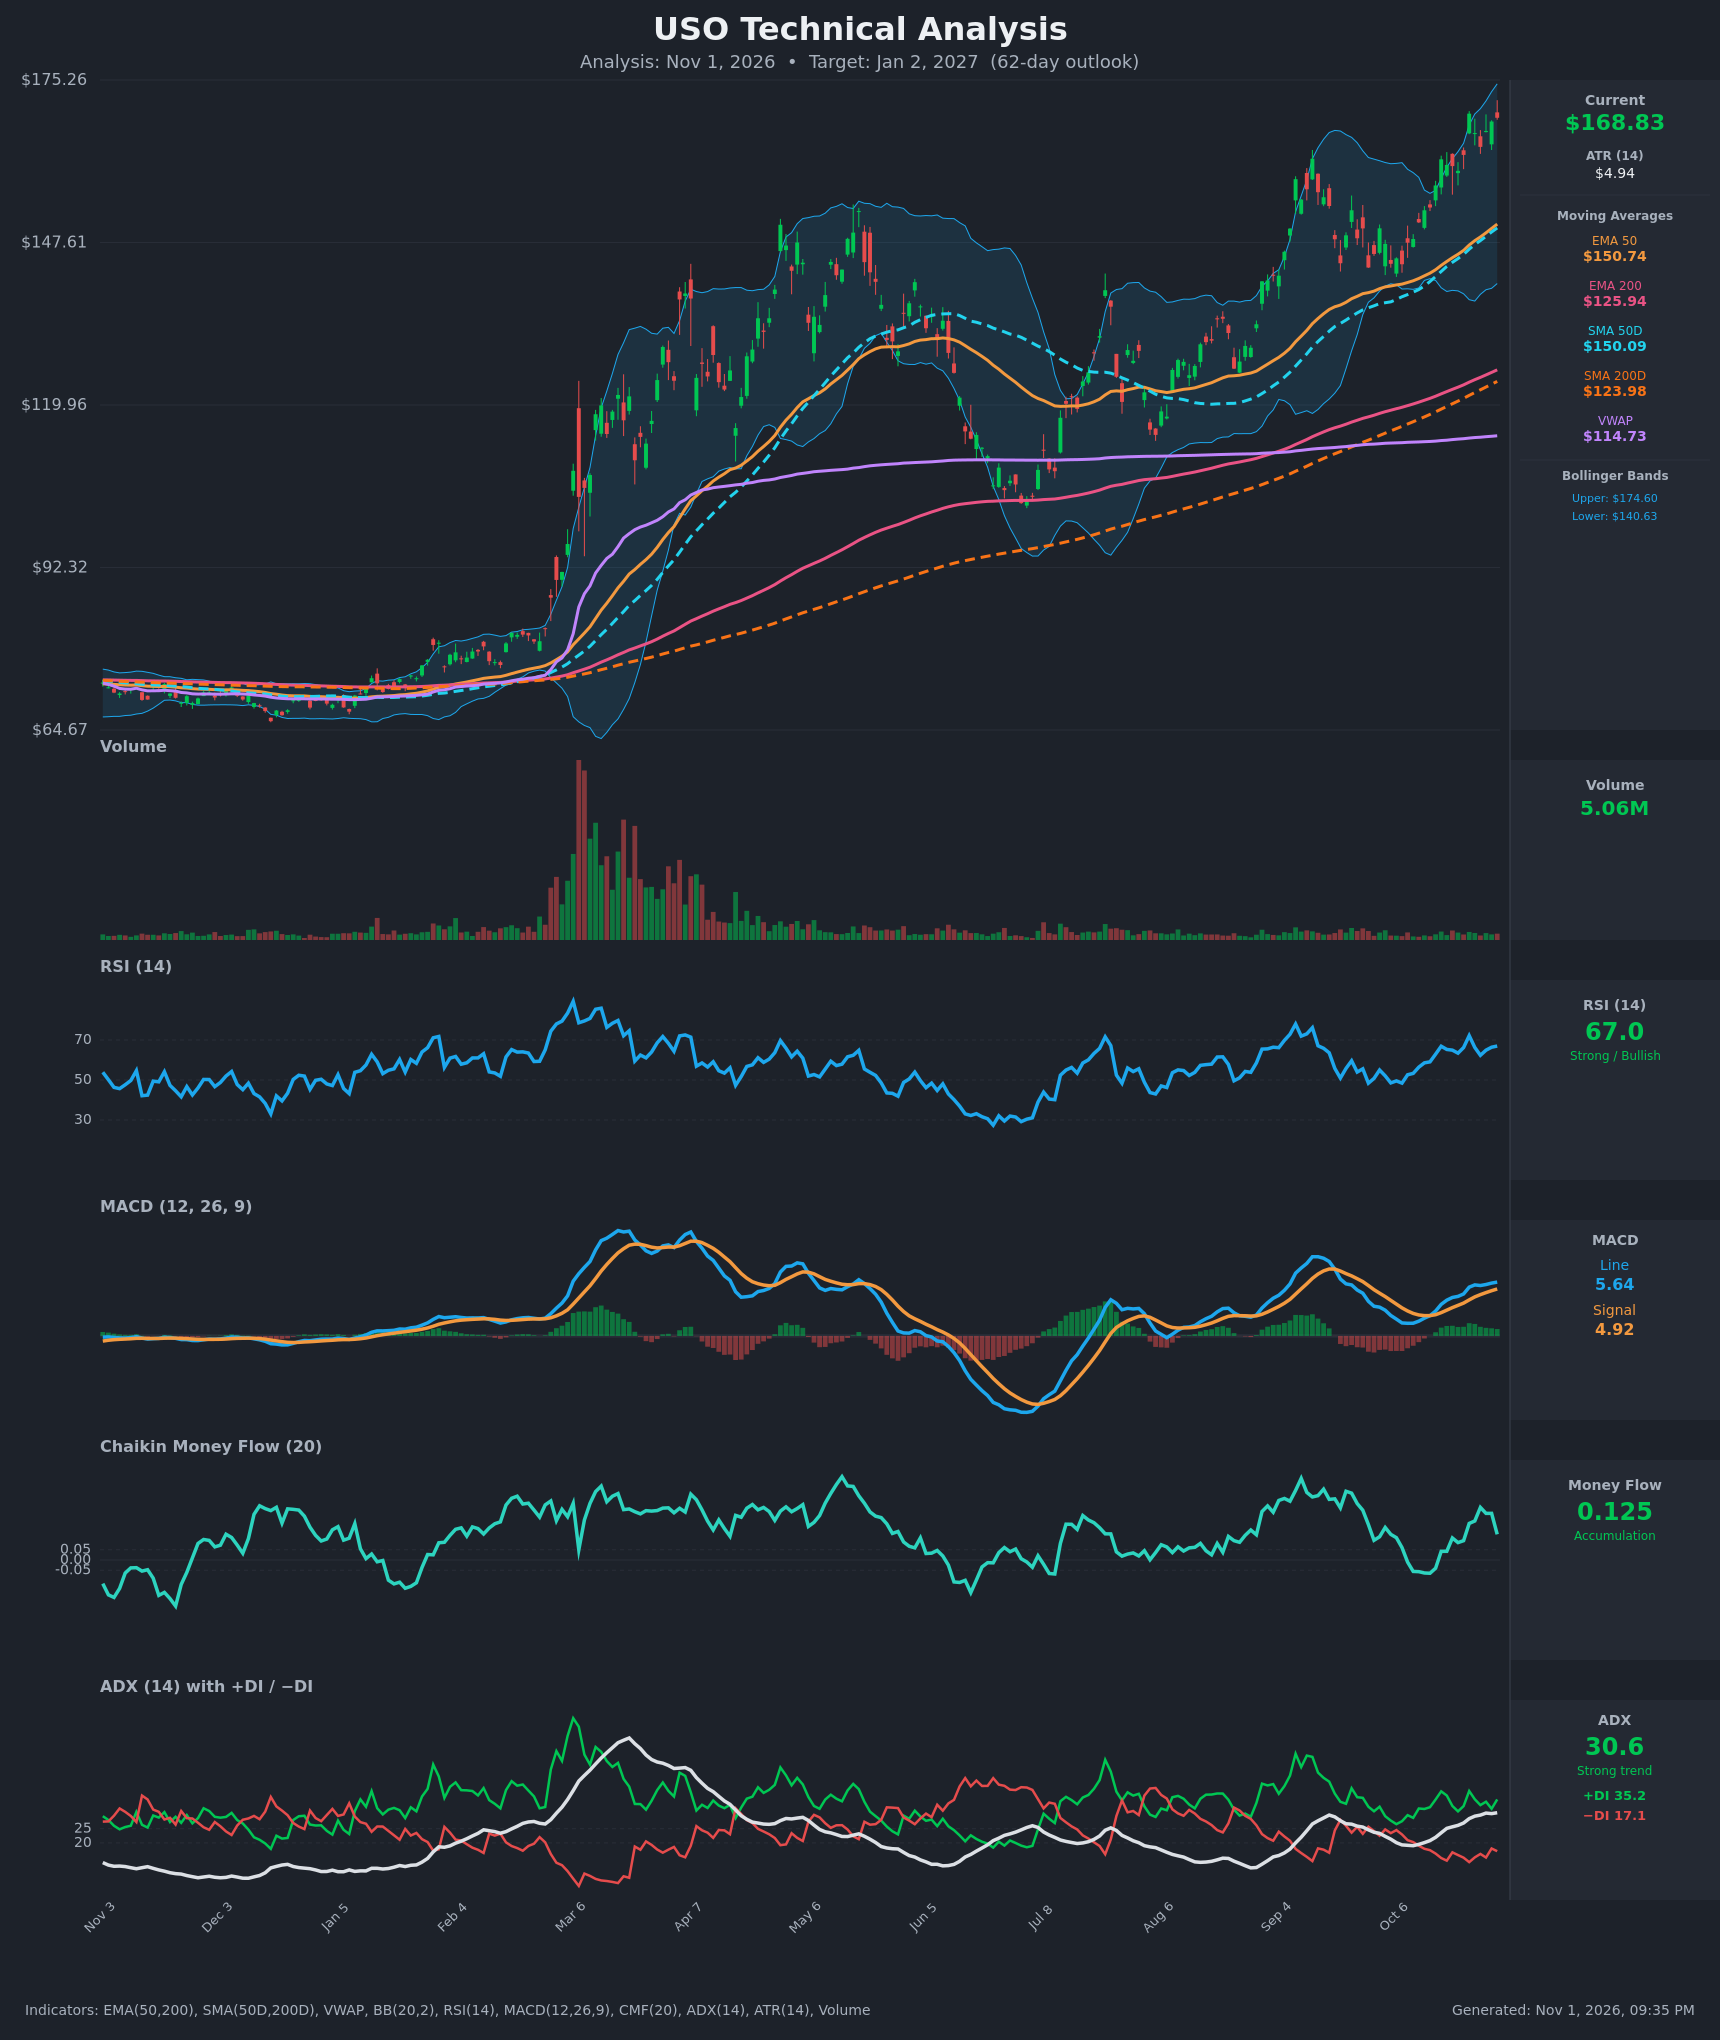
- RSI (14): 67.0, just below the 70 overbought line. It peaked at 72.2 on Oct 23 and has since held in the 62-67 range. Momentum is strong but not yet stretched, and price is making slightly higher closes with a lower RSI peak (a minor caution). [Bullish]
- 20 EMA: No 20 EMA value was supplied. The 50 EMA at $150.74 is rising, and price at $168.83 is about 12% above it, so trend support sits well below. The gap shows the move is extended. [Bullish]
- MACD: The line (5.639) is above the signal (4.918), and the gap has widened for 10+ bars. The histogram is positive and rising, with MACD at its highest since early in the year. There is no bearish crossover. [Bullish]
- Bollinger Bands (20): Upper $174.60, lower $140.63, so price is in the upper third of the bands, about $5.8 below the upper band. The bands are widening, which points to expanding volatility. Price is riding the upper half rather than reversing. [Bullish]
- CMF (20): 0.125, in accumulation territory (above +0.05) and positive since Oct 16. It has faded from 0.256 on Oct 27, so buying pressure is cooling slightly. [Accumulation]
- ADX (14): 30.6 and rising, a strong trend. +DI (35.2) is well above −DI (17.1), so bulls are in control, and ADX has climbed from 19.5 over two weeks. [Strong Trend + Bullish]
- Volume: 5.06M, ordinary to light compared with the March surge. The rally is not backed by a volume spike, so conviction is moderate. Up days show slightly better participation than the pullbacks. [Neutral to mildly supportive]
DIVERGENCES & TRENDS
- Moving averages: Price ($168.83) is above EMA50 ($150.74), SMA50D ($150.09), EMA200 ($125.94), SMA200D ($123.98) and VWAP ($114.73). The averages are stacked in bullish order, and the golden cross (SMA50D over SMA200D) is long established. The 50-day averages are only about 2% apart from each other and still rising.
- Mild RSI divergence: Price is near its highs, but RSI is below its Oct 23 peak of 72.2. This is a mild loss of momentum, not a confirmed bearish divergence.
- CMF fading: CMF fell from 0.256 to 0.125 while price held near highs, a small caution that accumulation is slowing.
- Trend structure: Higher highs and higher lows since the June-July trough (about $100). The September high of about $160 was broken in October.
- Extension risk: Price is far above VWAP and 12% above the 50-day averages. This raises the odds of a pullback toward the $150-160 zone, though it does not by itself reverse the trend.
- Crossovers: No bearish crossovers in MACD, DI or the moving averages. The DI spread is strongly positive.
CHART PATTERNS
- Ascending channel / bullish continuation: Since July the stock has made a sequence of higher lows (about $100, then $115-120, then $140), each followed by a breakout. This resembles the Bullish Flag Pattern (continuation). The Sep-Oct consolidation (about $140-$162) resolved upward.
- Measured-move target: The Sep-Oct consolidation was about $22 deep ($140-$162). Added to the breakout level (about $160), that implies roughly $180-$185, with the upper Bollinger Band at about $175 as first resistance.
- Reversal risk: No Double Top or Head and Shoulders is visible. The Oct 23 high of $169.53 is a minor resistance, and a failure there with a lower high would start a Double Top setup.
POTENTIAL SCENARIOS
- Scenario 1: Bullish Trend Continuation — The strong ADX, positive DI spread and rising MACD support more upside after any shallow pullback. Trigger: a daily close above $170 (the Oct 23 high) and the upper BB at about $175. Target: $177-$185. Invalidation: a daily close below $150 (EMA50/SMA50D). (50% probability)
- Scenario 2: Neutral Consolidation / Extended Chop — Price is stretched above its averages, so it digests gains in a range. Trigger: rejection at $170-$175 with RSI below 60. Target: range of $155-$172. Invalidation: a close above $176 or below $150. (30% probability)
- Scenario 3: Bearish Mean-Reversion Pullback — Fading CMF, the mild RSI divergence and the stretch above VWAP lead to a deeper correction. Trigger: a close below $160 with a MACD bearish cross. Target: $140-$150 (lower BB and 50-day averages). Invalidation: a reclaim of $170. (20% probability)
PRICE TARGETS
- Target Price: $177.00 (62-day, about +4.8%)
- Expected Range: $153.00 to $193.00 (width $40, about 23.7% of current price, consistent with the 18-30% guidance for 61-180 days)
- Key Levels: Support at $150.74 (EMA50, with SMA50D at about $150), Resistance at $175.26 (chart high and upper Bollinger Band area)
OVERALL BIAS
OVERALL BIAS: BULLISH - ADX at 30.6 with +DI far above −DI, MACD above its signal and still rising, price above all key moving averages, and CMF showing accumulation. Overextension and fading RSI/CMF argue for a pullback along the way, so the target is moderate at $177.
This is educational analysis and not financial advice.