META 76-day bearish forecast — Nov 1, 2026
- Bias: Bearish
- Timeframe: 76 days (made Nov 1, 2026, target date Jan 15, 2027)
- Price at analysis: $614.99
- Price target: $585.00
- Expected range: $520.00 – $675.00
- Result: Pending — graded after the close on Jan 15, 2027
Get a free AI analysis of META today
Analysis
TECHNICAL INDICATORS
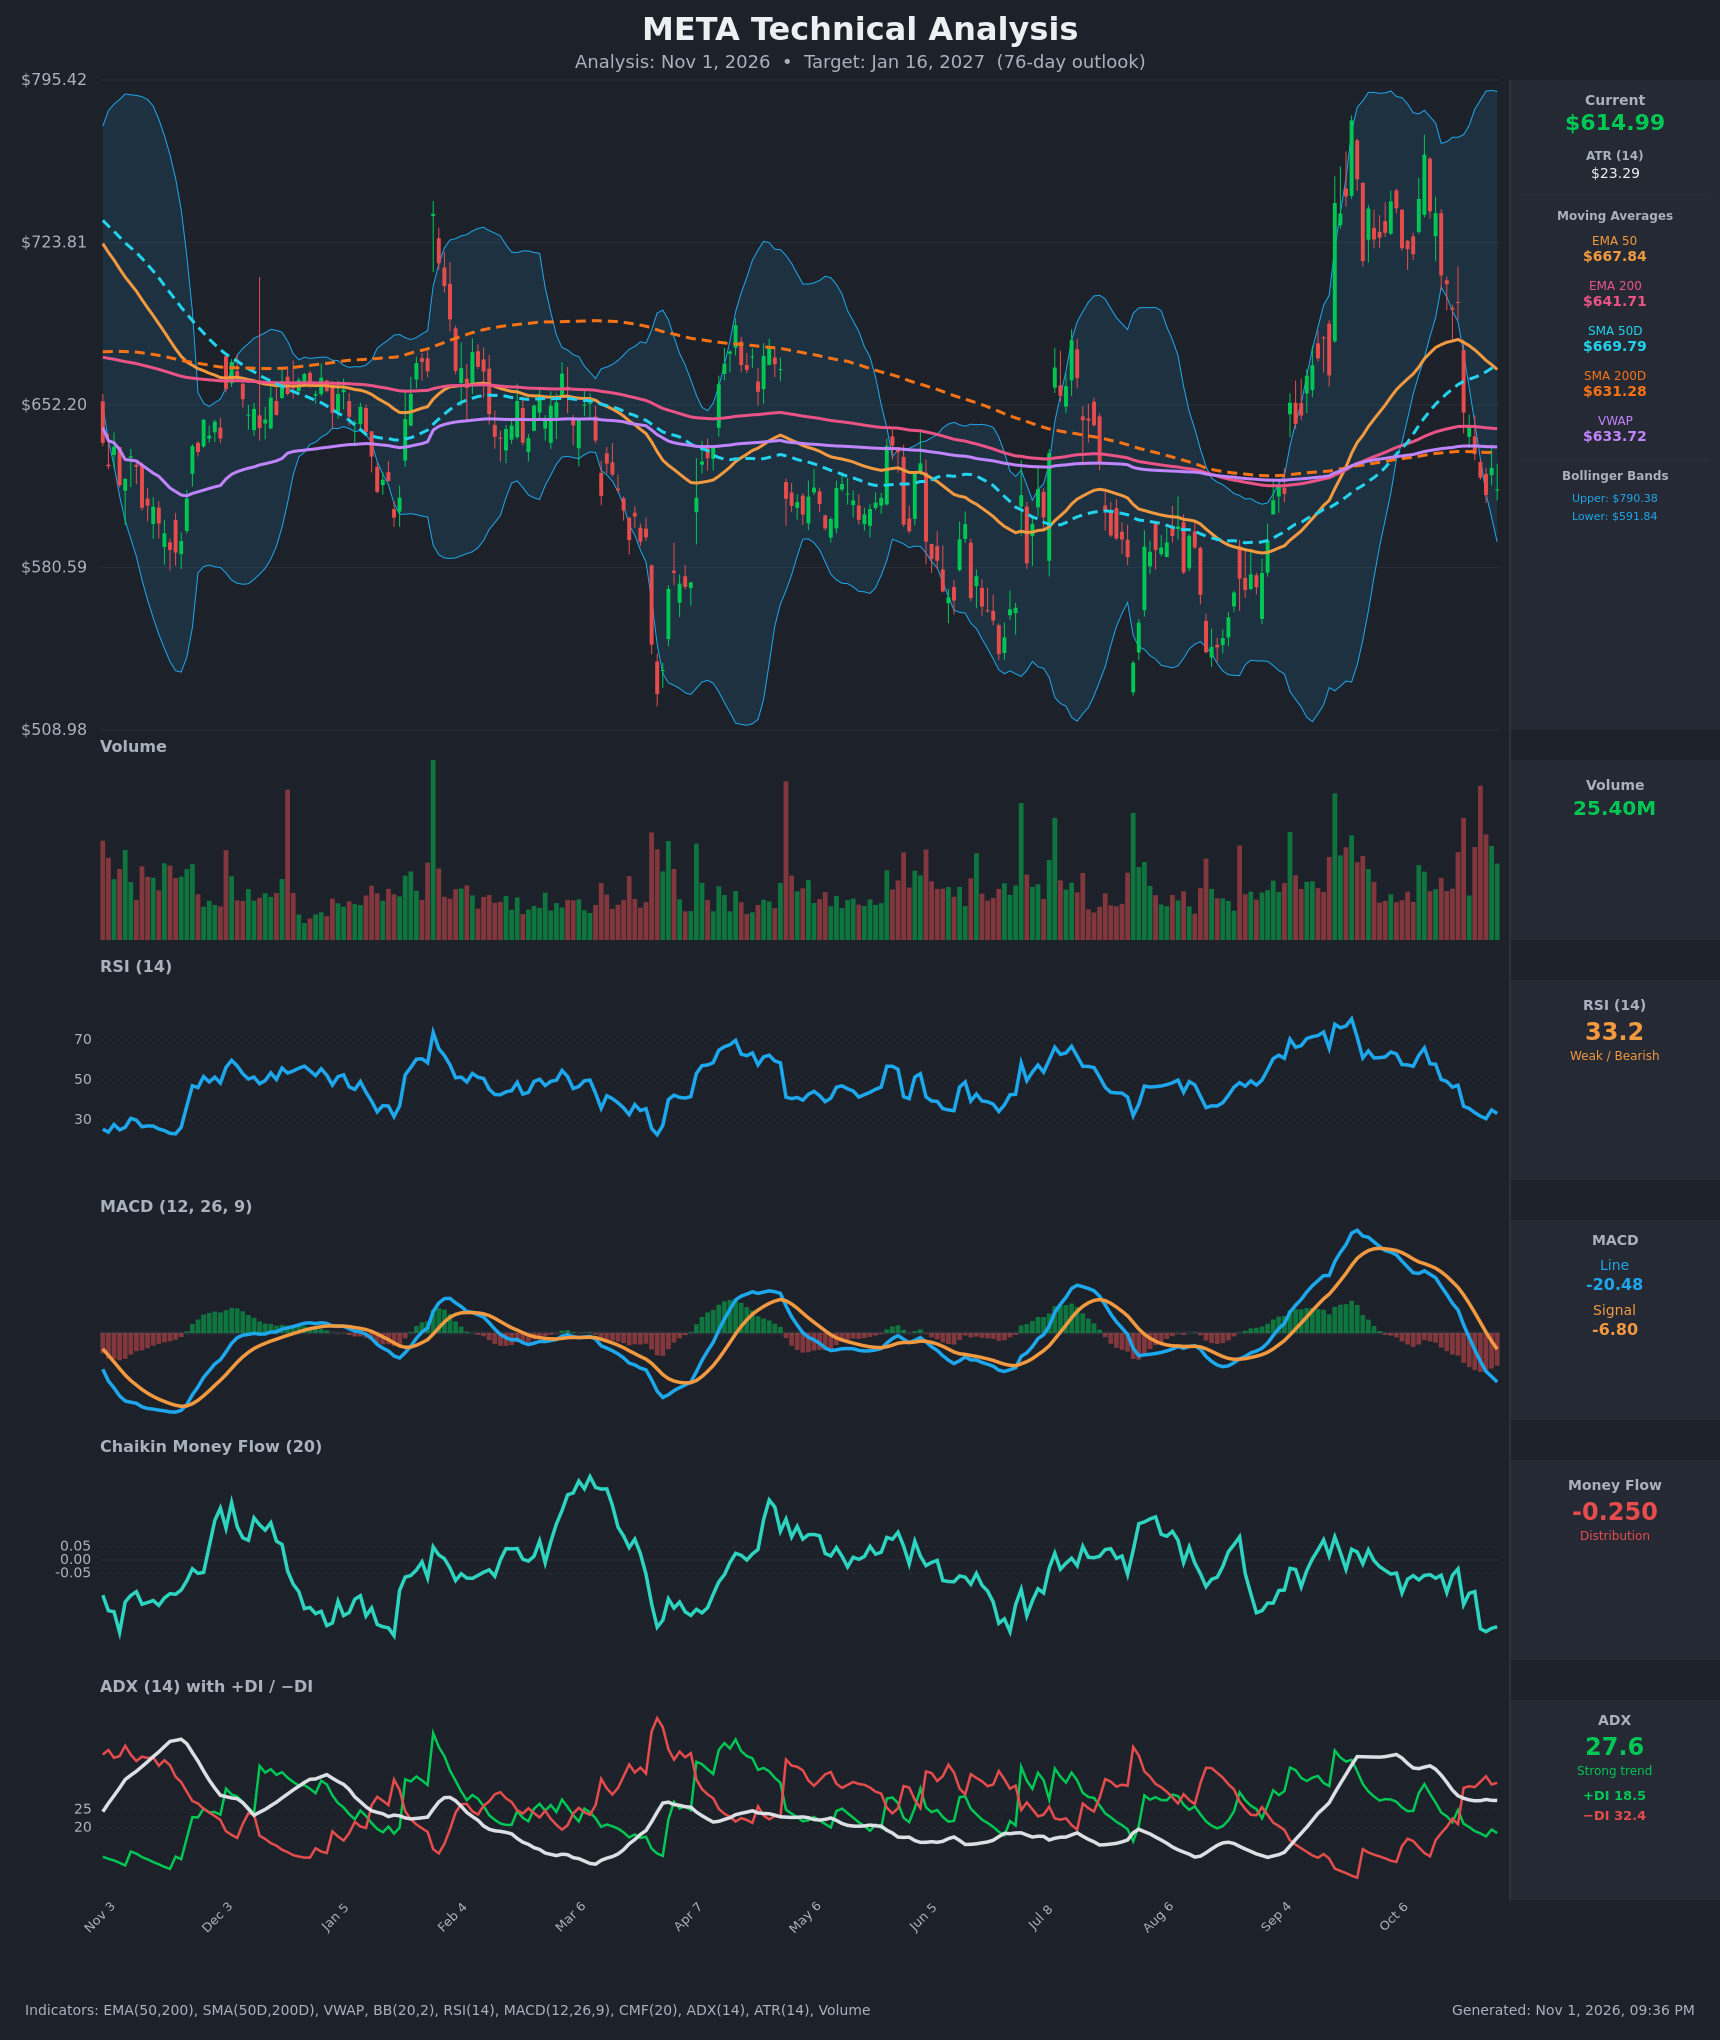
- RSI (14): 33.23, down from 66 on Oct 13 and sitting just above oversold (30). Momentum is clearly falling, and the Oct 28 low of 30.7 bounced only briefly. Oversold conditions can persist in a strong downtrend. [Bearish]
- 20 EMA: The 20 EMA is not provided. The EMA 50 ($667.84) and EMA 200 ($641.71) are both overhead, and price at $614.99 is below each. Both act as resistance, and the EMA 50 is rolling over (peaked ~$681). [Bearish]
- MACD: Line -20.48 is below signal -6.80, a histogram of about -13.7 that is widening. The bearish crossover happened around Oct 23, and the line is well below zero and still accelerating down. [Bearish]
- Bollinger Bands (20): Upper $790.38, lower $591.84. Price is in the lower third of the bands, about $23 (roughly 1 ATR) above the lower band. The bands are very wide after the September spike, so volatility is elevated. A band walk toward the lower band is underway, and a lower-band tag around $592 is likely. [Bearish]
- CMF (20): -0.250, well below -0.05 and near the lowest reading on the chart. It has been persistently negative since mid-October, which shows heavy distribution. [Distribution]
- ADX (14): 27.6 with −DI (32.4) well above +DI (18.5). The trend is strong and bearish, with ADX still above 25 even though it is off its 37 peak. The DI crossover to bearish came on Oct 22. [Strong Trend – Bearish]
- Volume: 25.40M, with elevated volume on the recent red candles in the selloff from ~$760 to ~$615. The heavy volume on the decline points to sellers in control. [Bearish – distribution on down moves]
DIVERGENCES & TRENDS
- No bullish RSI or MACD divergence has formed. Price made lower lows from Oct 22–30 and RSI and MACD made lower lows with it.
- RSI is approaching 30 but has not reached true oversold or a reversal. The Oct 29 bounce to $624.52 faded the next day.
- The MACD bearish crossover (Oct 23) and the −DI > +DI crossover (Oct 22) both confirm the downtrend.
- Price has fallen below the EMA 200 ($641.71), SMA 200D ($631.28), and VWAP ($633.72), and all three are now overhead resistance in the $631–$642 cluster.
- The SMA 50D ($669.79) is still above the SMA 200D ($631.28), so no death cross yet. The SMA 50D has started to flatten and may roll over.
- The September rally from ~$560 to ~$760 has fully reversed in about six weeks, which looks like a failed breakout and a lower high versus the prior range.
CHART PATTERNS
- The chart most resembles a Bearish Head and Shoulders / Double Top reversal at the top: a spike to ~$760 in early/mid October, a lower high near $737 on Oct 14–15, and a breakdown through the $640–$650 neckline zone (Oct 22).
- A measured move from the ~$760 peak down to the ~$645 breakdown area implies a further ~$115 decline, putting the downside target at roughly $530–$560. That is also the prior range-low region (~$560 in Aug and ~$510–$530 in March/April).
- A Bearish Flag/Pennant could form if price consolidates in the $615–$640 range. A close below the Bollinger lower band (~$592) would confirm continued downside.
- Near-term bounce potential is capped by the $631–$642 moving-average cluster.
POTENTIAL SCENARIOS
- Scenario 1: Bearish Trend Continuation — The breakdown extends, with price losing the $592 lower band and working toward the prior range lows. MACD stays below zero, −DI stays dominant, and CMF stays negative. Trigger: daily close below $592. Target: $540–$560. Invalidation: daily close above $642 (the EMA 200 and SMA 200D cluster). (50% probability)
- Scenario 2: Neutral/Bearish Relief Bounce, Then Range — An oversold bounce (RSI near 30) takes price back to the $631–$650 resistance cluster, where it stalls and chops between ~$575 and ~$650. Trigger: hold above $592 with RSI turning up. Target: $640–$650, with a fade afterward. Invalidation: break above $670 (SMA 50D / EMA 50) would shift to bullish. (30% probability)
- Scenario 3: Bullish Reversal — Dip buyers defend $590, price reclaims the EMA 200 and SMA 200D, and the rally resumes toward the EMA 50 and SMA 50D. Trigger: close above $642 on strong volume plus a MACD histogram turn. Target: $670–$700. Invalidation: close below $585. (20% probability)
PRICE TARGETS
For a 76-day horizon (range width guidance ~18–30% of price; here ~25%, or about $154):
- Target Price: $585.00
- Expected Range: $520.00 to $675.00 (width $155 ≈ 25.2% of current price)
- Key Levels: Support at $591.84 (lower Bollinger Band; below that ~$560), Resistance at $631.28 (SMA 200D, followed by the EMA 200 at $641.71)
OVERALL BIAS
OVERALL BIAS: BEARISH - Price has broken below the EMA 200, SMA 200D, and VWAP with a bearish MACD crossover, −DI dominance with ADX above 25, and deeply negative CMF (-0.25). Rallies are likely to meet resistance at $631–$642, and the target sits below current price.
This is educational analysis and not financial advice.