MU 76-day bearish forecast — Nov 1, 2026
- Bias: Bearish
- Timeframe: 76 days (made Nov 1, 2026, target date Jan 15, 2027)
- Price at analysis: $884.74
- Price target: $830.00
- Expected range: $720.00 – $950.00
- Result: Pending — graded after the close on Jan 15, 2027
Get a free AI analysis of MU today
Analysis
TECHNICAL INDICATORS
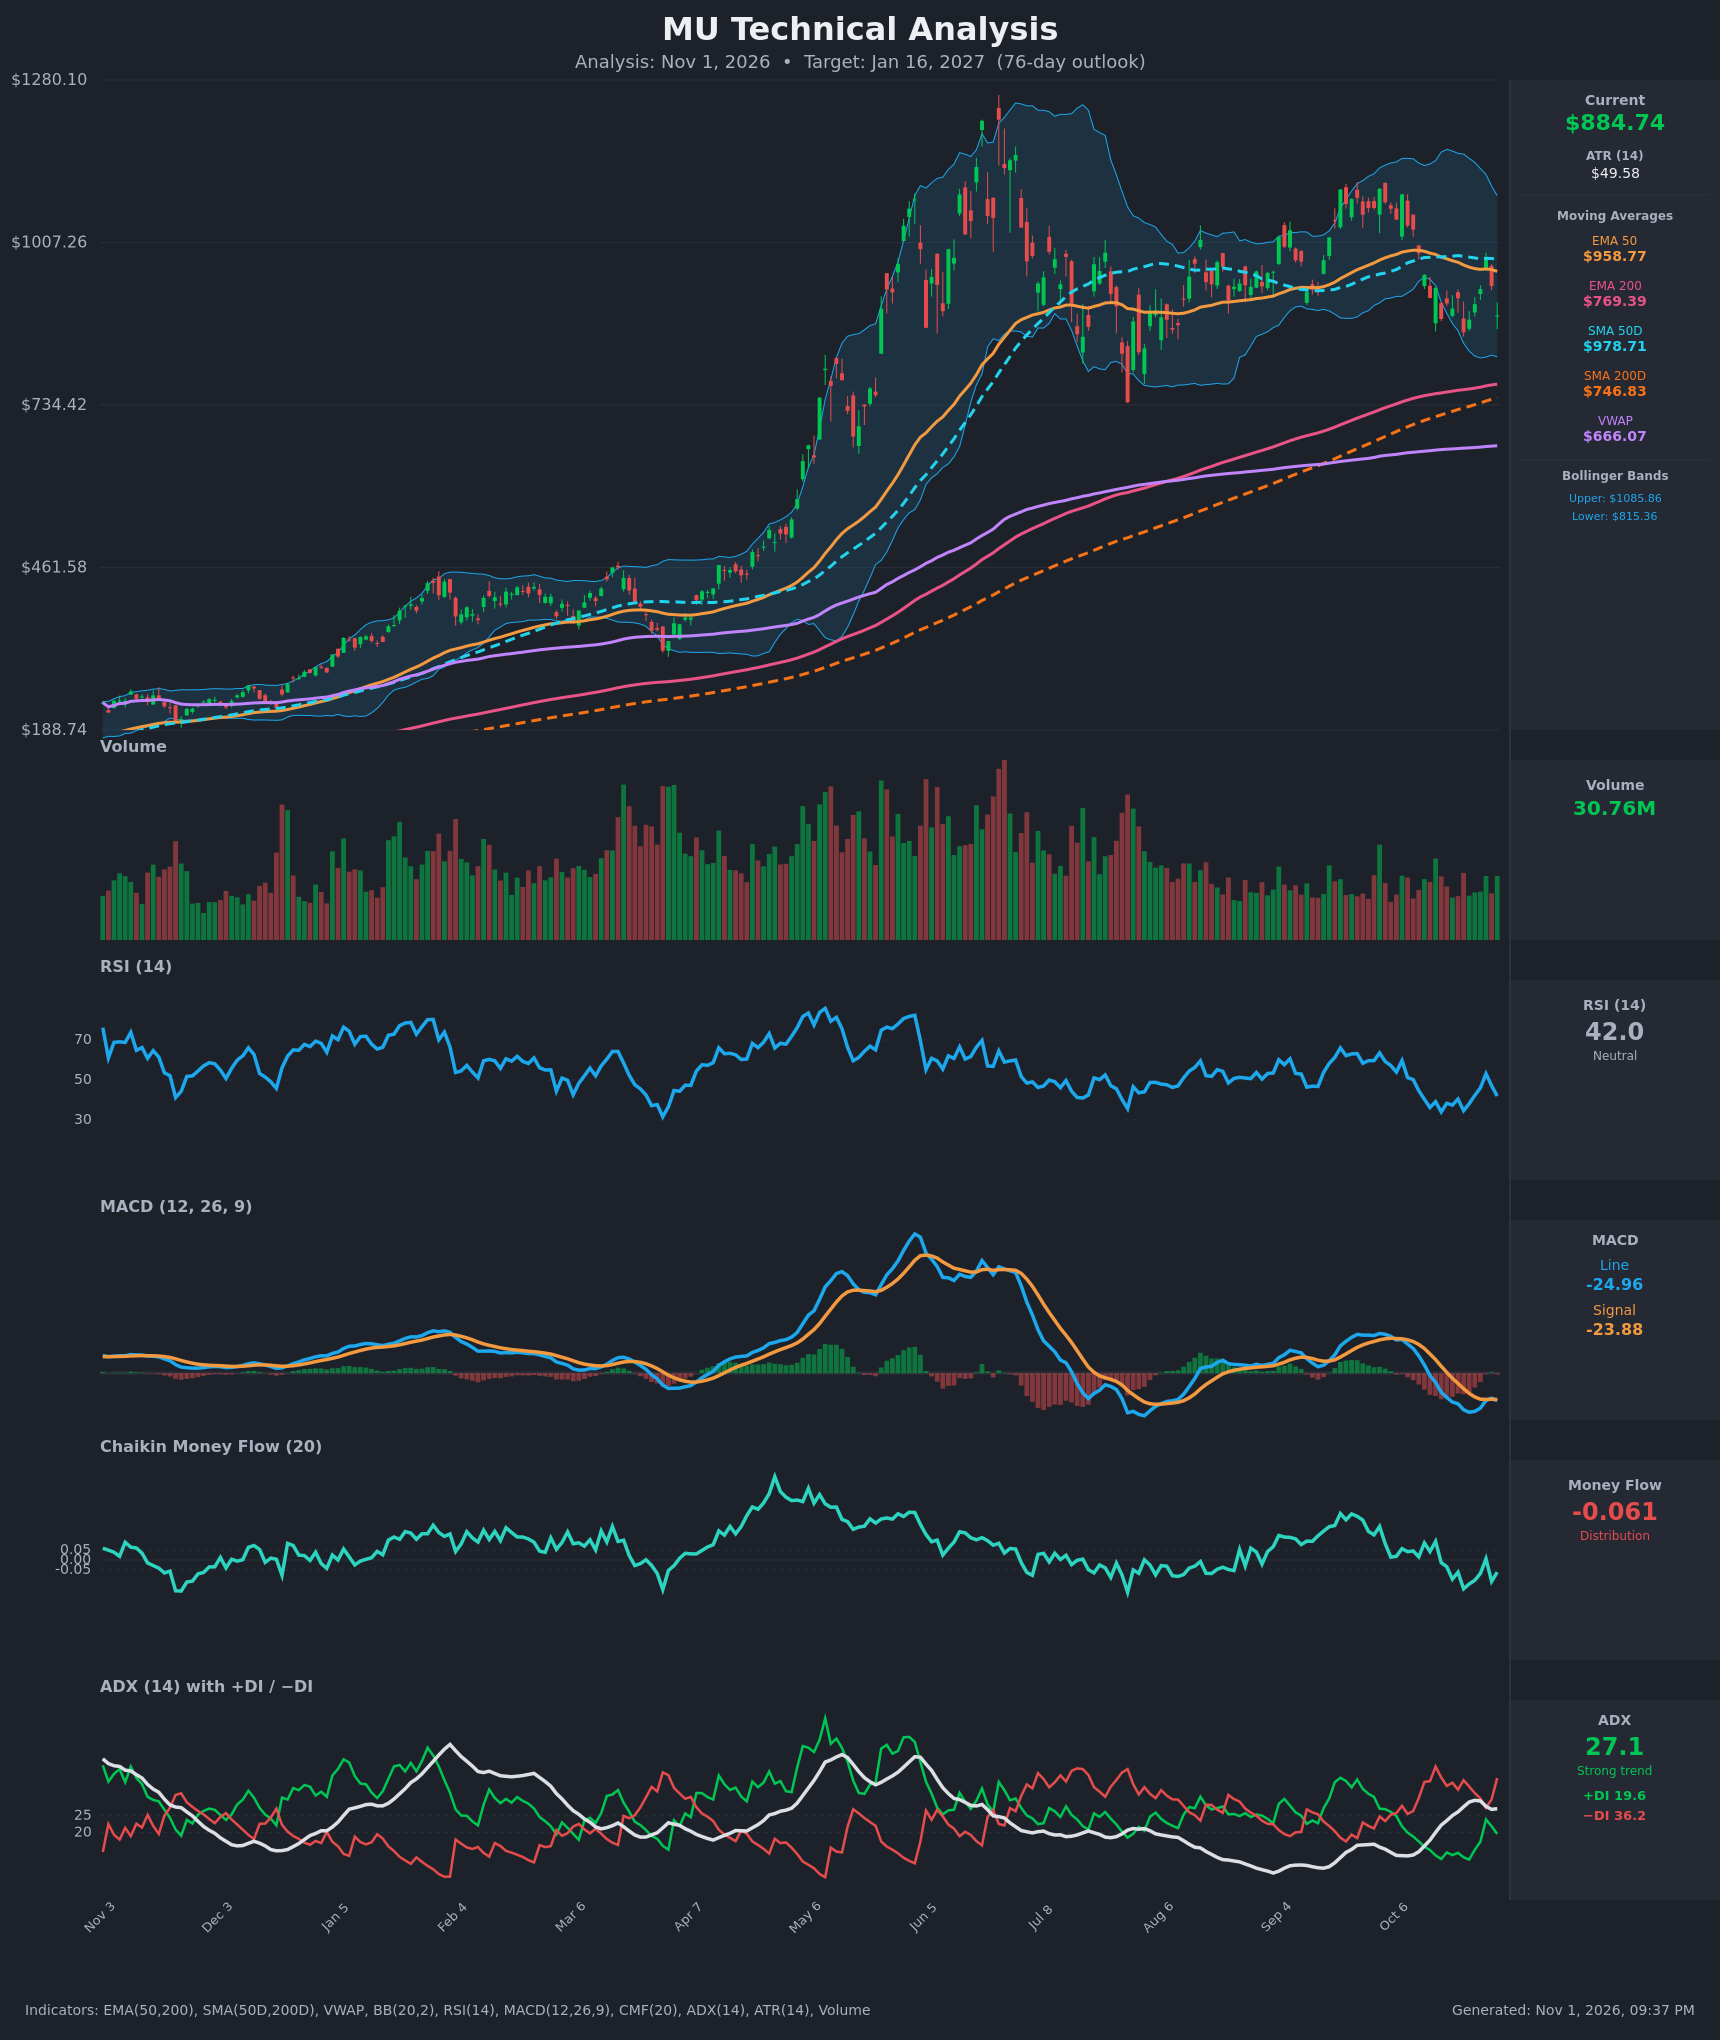
- RSI (14): 41.98, below the 50 midline and recovering from a 34 low on Oct 22. It was rejected at 53 on Oct 28 and has rolled over. Momentum is weak but not oversold. [Bearish]
- 20 EMA: The 20 EMA is not supplied, but the EMA 50 is $958.77 and falling. Price at $884.74 is about 7.7% below it, so it acts as overhead resistance. Price is also below the SMA 50D at $978.71. [Bearish]
- MACD: Line -24.96 is below Signal -23.88, a fresh bearish re-cross after a brief convergence on Oct 28-29. Both lines are negative and the histogram is slightly negative, so momentum is soft and bearish. [Bearish]
- Bollinger Bands (20): Upper $1085.86, lower $815.36, midline about $950. Price sits in the lower half, about 26% of the band width above the lower band. The bands are wide, which means high volatility, and price is rejecting from the midline. [Bearish]
- CMF (20): -0.061, below the -0.05 threshold and mostly negative since mid-Oct, with only a brief flicker to +0.006. This indicates mild distribution. [Distribution]
- ADX (14): 27.1 and rising from 14 in mid-Oct. −DI (36.2) is well above +DI (19.6), so there is a strong downtrend with bears in control. [Strong Trend – Bearish]
- Volume: 30.76M, average to below average. Red bars on the recent selloff days are somewhat heavier than the green rebounds, but there is no capitulation spike. [Neutral-to-Bearish]
DIVERGENCES & TRENDS
- Price has been consolidating between about $860 and $1,050 since July. It has now made lower highs ($983 on Oct 28 against $1,040+ earlier) and is testing the range floor.
- RSI is making lower highs (53 versus 65+ earlier) and MACD has moved below zero. This confirms bearish momentum rather than diverging from price.
- No clear bullish divergence yet. The RSI low of 34 on Oct 22 against 42 now is not a price divergence, because price has not made a new lower low.
- The EMA 50 ($958.77) is rolling over and is about to cross below the SMA 50D. EMA 50 is still far above EMA 200 ($769.39), and SMA 50D is above SMA 200D ($746.83), so there is no death cross. The long-term uptrend is intact.
- The ADX turn-up with −DI dominance signals that a corrective phase is gaining strength.
- Price is well above VWAP ($666) and both 200-period averages. The long-term structure is bullish, but the medium term is correcting.
CHART PATTERNS
- The price action since June resembles a Bearish Double/Triple Top (highs around $1,040-$1,050 in Jul, Aug and Oct) within a broad range. Recent rejection near $983 and a break below the roughly $860-$880 support would complete a top.
- The prior vertical advance and the sideways, slightly descending consolidation also resemble a Bullish Flag/Pennant. That would be invalidated by a break of $815 or lower.
- The more probable read is a topping range with a measured move of roughly $1,050 minus $860, or about $190, which points to roughly $670-$700 on a clean break. That target lines up with the SMA/EMA 200 cluster ($747-$769) and VWAP ($666).
- The first support zone is the lower Bollinger Band (~$815) and the July low (~$735 wick).
POTENTIAL SCENARIOS
- Scenario 1: Bearish Range Breakdown and Retest of the 200s — Price loses the $856 swing low and the lower Bollinger Band, then drifts toward the long-term moving averages as −DI stays dominant. Trigger: daily close below $856 and then $815. Target: $740-$770 (EMA/SMA 200 zone). Invalidation: daily close above $960 (EMA 50). (45% probability)
- Scenario 2: Neutral Choppy Consolidation — Price holds the $815-$985 range, bouncing off the lower band with RSI cycling around 40-55 as the 50-day averages flatten. Trigger: holds $856 with repeated rejections near $950-$985. Target: $860-$940. Invalidation: close below $815 or above $990. (25% probability)
- Scenario 3: Bullish Reclaim and Flag Breakout — Buyers defend $856-$880 and the uptrend resumes with a reclaim of the 50-day averages. Trigger: close above $985 with MACD crossing up and CMF above +0.05. Target: $1,050-$1,100. Invalidation: close below $850. (30% probability)
PRICE TARGETS
For the 76-day horizon (about Jan 16, 2027), the guideline range width is 18-30% of price, so roughly $159-$265 wide. The chosen range is $720 to $950, which is $230 wide, or 26% of the current price.
- Target Price: $830.00
- Expected Range: $720.00 to $950.00
- Key Levels: Support at $815.00, Resistance at $958.77
OVERALL BIAS
OVERALL BIAS: BEARISH - Price is below the falling EMA 50 and SMA 50D, MACD is negative with a new bearish cross, ADX is 27 and rising with −DI far above +DI, and CMF shows distribution. The long-term uptrend above the 200-period averages limits downside to a probable test of the $750-$815 area.
This is educational analysis and not financial advice.