USO 76-day bullish forecast — Nov 1, 2026
- Bias: Bullish
- Timeframe: 76 days (made Nov 1, 2026, target date Jan 15, 2027)
- Price at analysis: $168.83
- Price target: $177.00
- Expected range: $150.00 – $190.00
- Result: Pending — graded after the close on Jan 15, 2027
Get a free AI analysis of USO today
Analysis
TECHNICAL INDICATORS
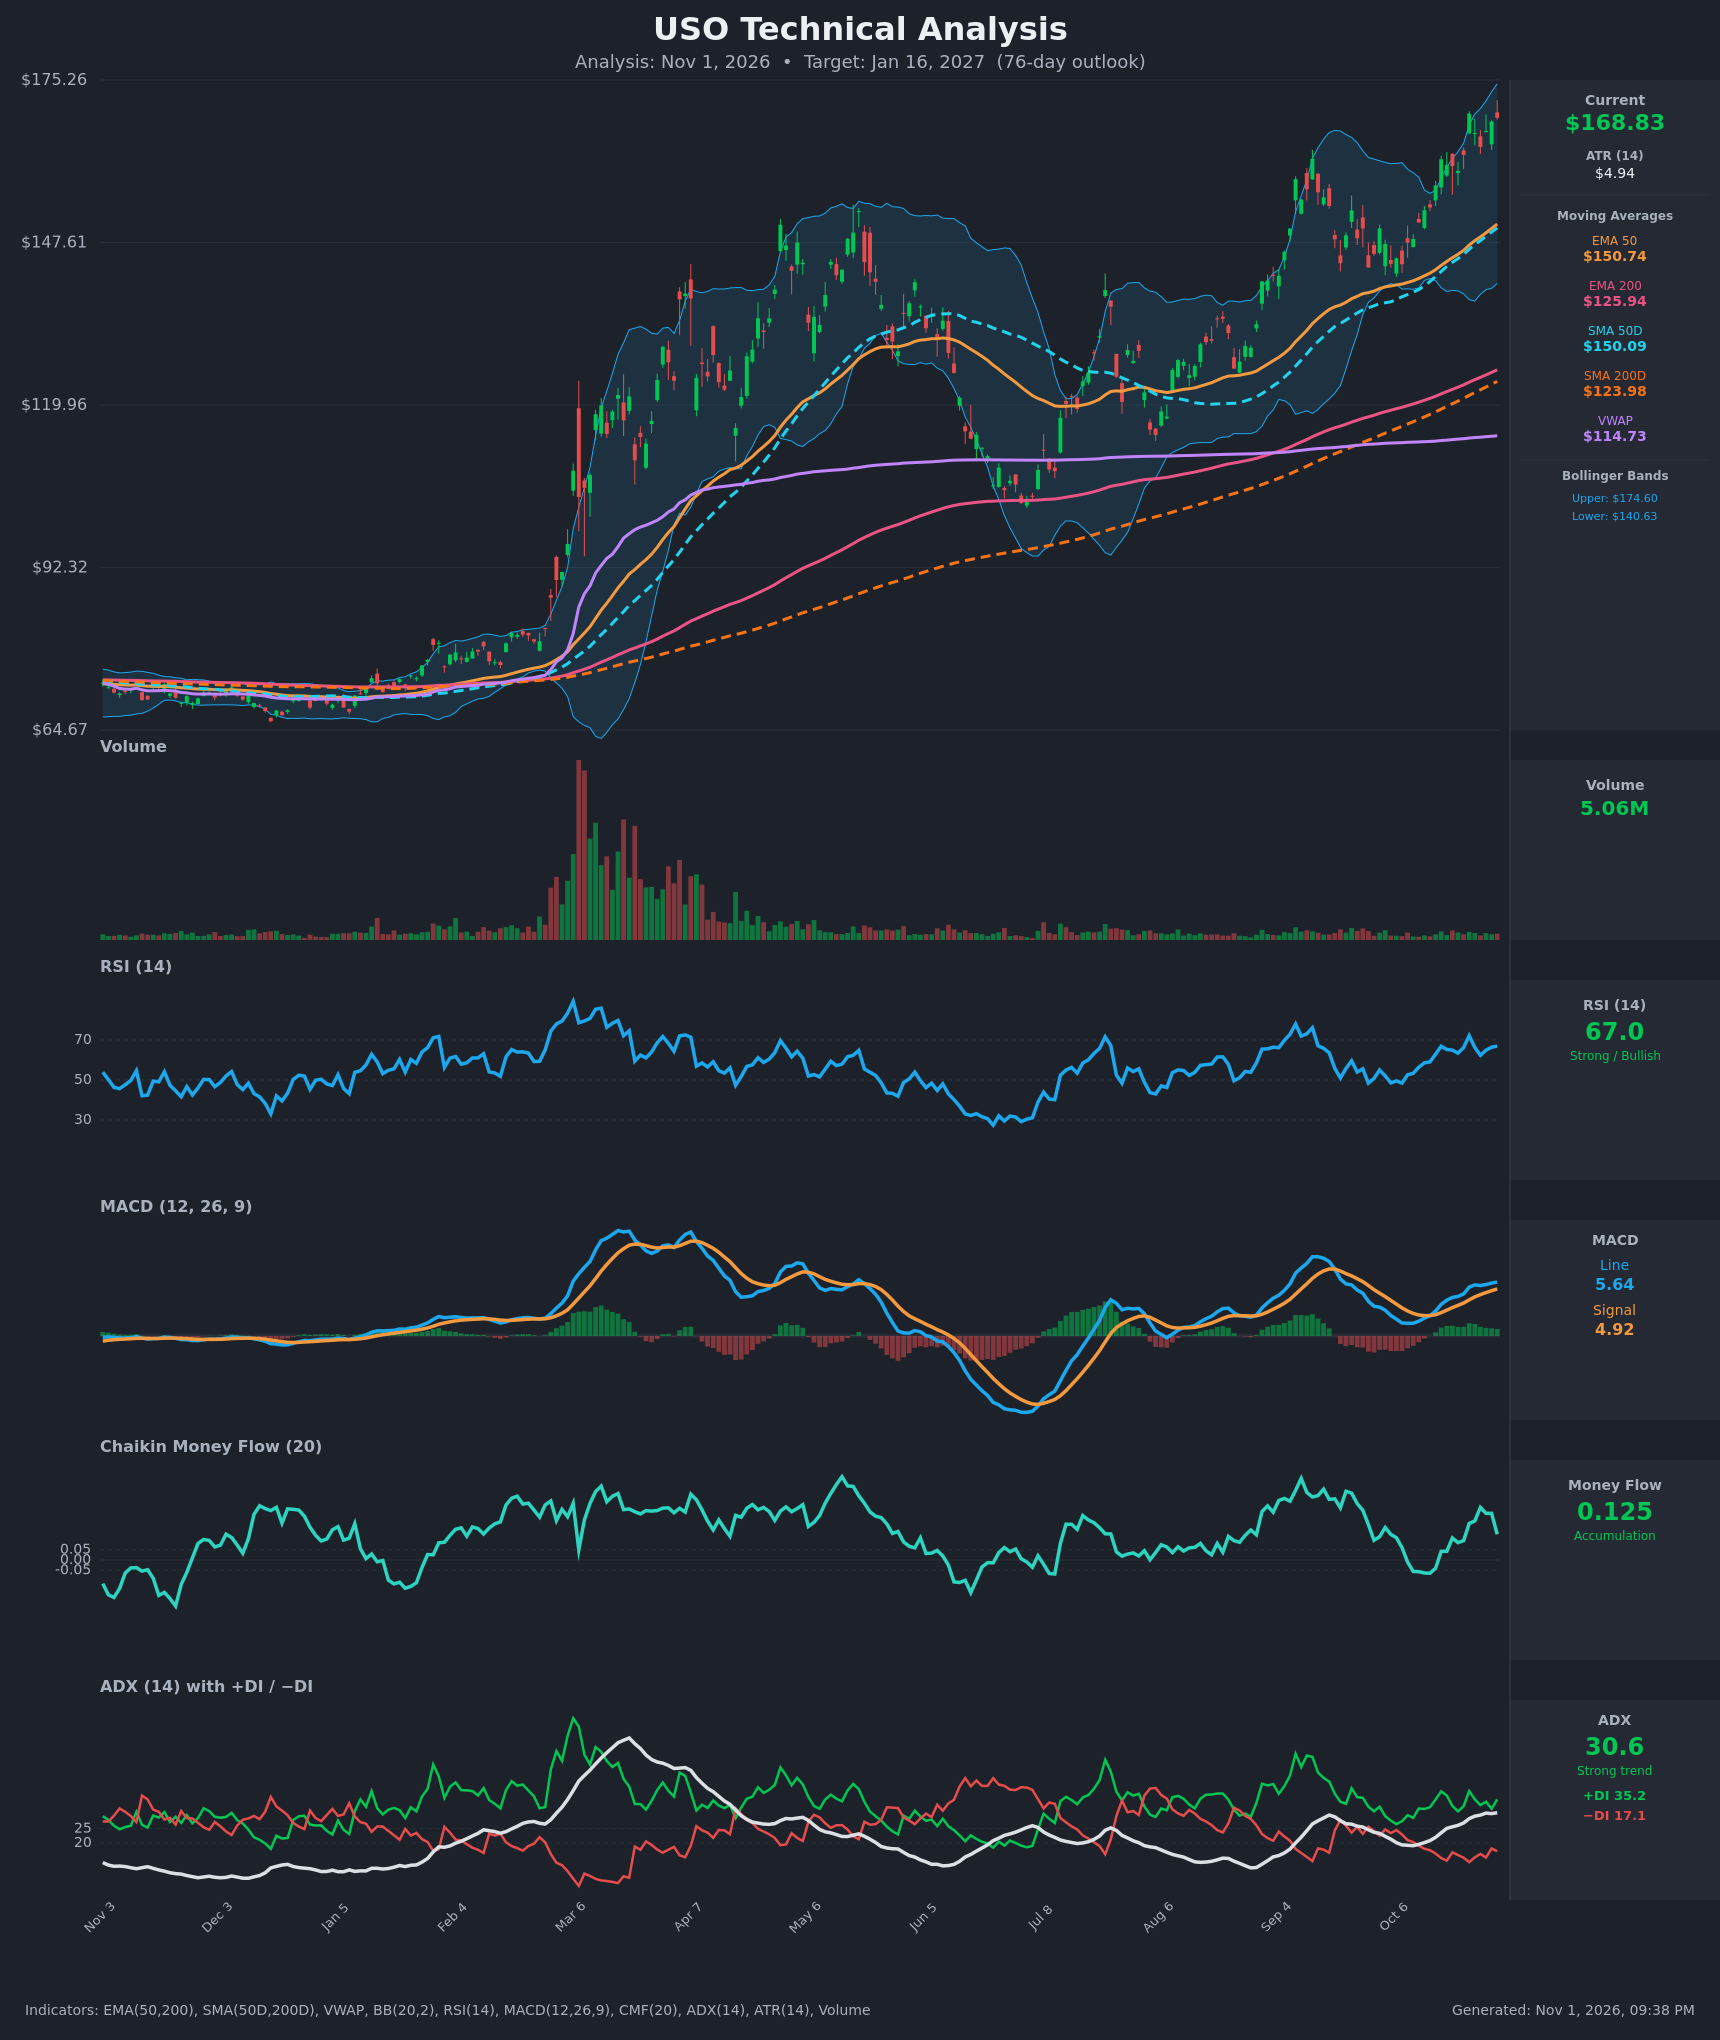
- RSI (14): 66.98, just under the 70 overbought line. It has climbed from the 50s in mid-October, with a spike to 72.2 on Oct 23, and is making higher lows. Momentum is strong but near the point where pullbacks often start. [Bullish]
- 20 EMA: Not supplied. The 20-day Bollinger midline (about $157.6) stands in for it, and price sits about 7% above it. The supplied EMA 50 is $150.74, with price about 12% above, and the EMA 200 is $125.94. All are rising and stacked in bullish order. [Bullish]
- MACD: Line 5.639 is above signal 4.918 (histogram about +0.72). The line has stayed above the signal since about Oct 14-15 and the gap is widening. The line is also above zero, near its September high. [Bullish]
- Bollinger Bands (20): Upper $174.60, lower $140.63, midline about $157.6. Price at $168.83 is about 83% of the way up the band (%B ≈ 0.83). Price is riding the upper half and the bands are expanding. That is a trend-walk signal, but there is limited room before the upper band at about $174.60. [Bullish]
- CMF (20): 0.125, above the +0.05 threshold, and positive since Oct 16, peaking at 0.256 on Oct 27. The latest dip from 0.227 to 0.125 shows buying pressure cooling slightly. [Accumulation]
- ADX (14): 30.6 and rising (19.5 on Oct 12). +DI at 35.2 is well above −DI at 17.1, roughly 2:1. This is a strong, established uptrend. [Strong Trend + Bullish]
- Volume: 5.06M, which is average to below average. It is far below the massive volume spike around Mar 6. The advance is steady rather than climactic, so there is no blow-off signature, but there is also no surge confirming the breakout. [Neutral to mildly supportive]
DIVERGENCES & TRENDS
- There is no clear bearish RSI or MACD divergence. Price made a higher high at $169.53 on Oct 23, and RSI (72.2 → 67.0) and MACD are both near or above their prior-peak levels. The RSI peak on Oct 23 was higher than the current reading, so momentum is not accelerating on the latest push. This is a mild caution, not a divergence.
- The golden cross is long established: SMA50D ($150.09) is far above SMA200D ($123.98), and EMA50 is above EMA200. Price is above every moving average and VWAP ($114.73), which is a long-term uptrend.
- The MACD bullish cross and the ADX/DI structure have both strengthened over the last 15 bars. −DI is falling and ADX is above 25.
- Price is stretched about 47% above VWAP and about 12% above the EMA 50. Extended readings like this raise the odds of a pullback or consolidation, even within an uptrend.
CHART PATTERNS
- Bullish Flag / consolidation breakout: The September-October pullback and sideways drift (roughly $140–$162) resolved upward with a breakout above the September high into new highs near $169-$175. The measured move of the prior leg (about $20-$25) points to roughly $185-$195 over time.
- Higher highs and higher lows: Since the July low, the sequence resembles a rising staircase (an ascending-channel continuation).
- Caution – minor Double Top: The $169.53 (Oct 23) and $168.83 (Oct 30) highs form a possible small double top near the upper Bollinger Band. The neckline is around $160-$164 (the Oct 27 low was $163.88). A close below about $160 would activate this bearish reversal pattern, with a pullback target near $150, the EMA 50.
POTENTIAL SCENARIOS
- Scenario 1: Bullish Trend Continuation — The strong ADX, +DI dominance, positive CMF and the flag breakout carry price to new highs, with shallow pullbacks to the $157-$162 area that hold. Trigger: a daily close above $175.26 (the chart high and upper band). Target: $185-$195, with $177 as the central 76-day estimate. Invalidation: a close below $155 (below the Bollinger midline). (50% probability)
- Scenario 2: Neutral Consolidation Below Highs — An overextended, overbought market digests gains in a $155-$175 range while the EMA 50 catches up. Trigger: repeated rejection near $170-$175 with RSI fading below 60. Target: $155-$172. Invalidation: a close above $176 or below $150. (25% probability)
- Scenario 3: Bearish Double-Top Pullback — The minor double top confirms, momentum fades, and price mean-reverts toward the rising moving averages. Trigger: a close below $160 with MACD crossing below its signal. Target: $145-$150 (EMA 50/SMA 50D area). Invalidation: a reclaim of $170. (25% probability)
PRICE TARGETS
- Target Price: $177.00 (76-day horizon, Jan 16, 2027)
- Expected Range: $150.00 to $190.00 (width $40, about 23.7% of the current price, in line with the 18–30% guidance for 61–180 days)
- Key Levels: Support at $160.00 (Oct consolidation lows and double-top neckline area), Resistance at $175.26 (chart high and upper Bollinger Band)
OVERALL BIAS
OVERALL BIAS: BULLISH - Price is above all key moving averages with a golden cross in place, MACD is above its signal and widening, ADX is 30.6 with +DI roughly double −DI, and CMF shows accumulation. The main risks are overbought conditions near the upper band and a possible minor double top, so conviction is moderate.
This is educational analysis and not financial advice.