ASTS 97-day bearish forecast — Nov 1, 2026
- Bias: Bearish
- Timeframe: 97 days (made Nov 1, 2026, target date Feb 5, 2027)
- Price at analysis: $40.97
- Price target: $37.00
- Expected range: $28.00 – $50.00
- Result: Pending — graded after the close on Feb 5, 2027
Get a free AI analysis of ASTS today
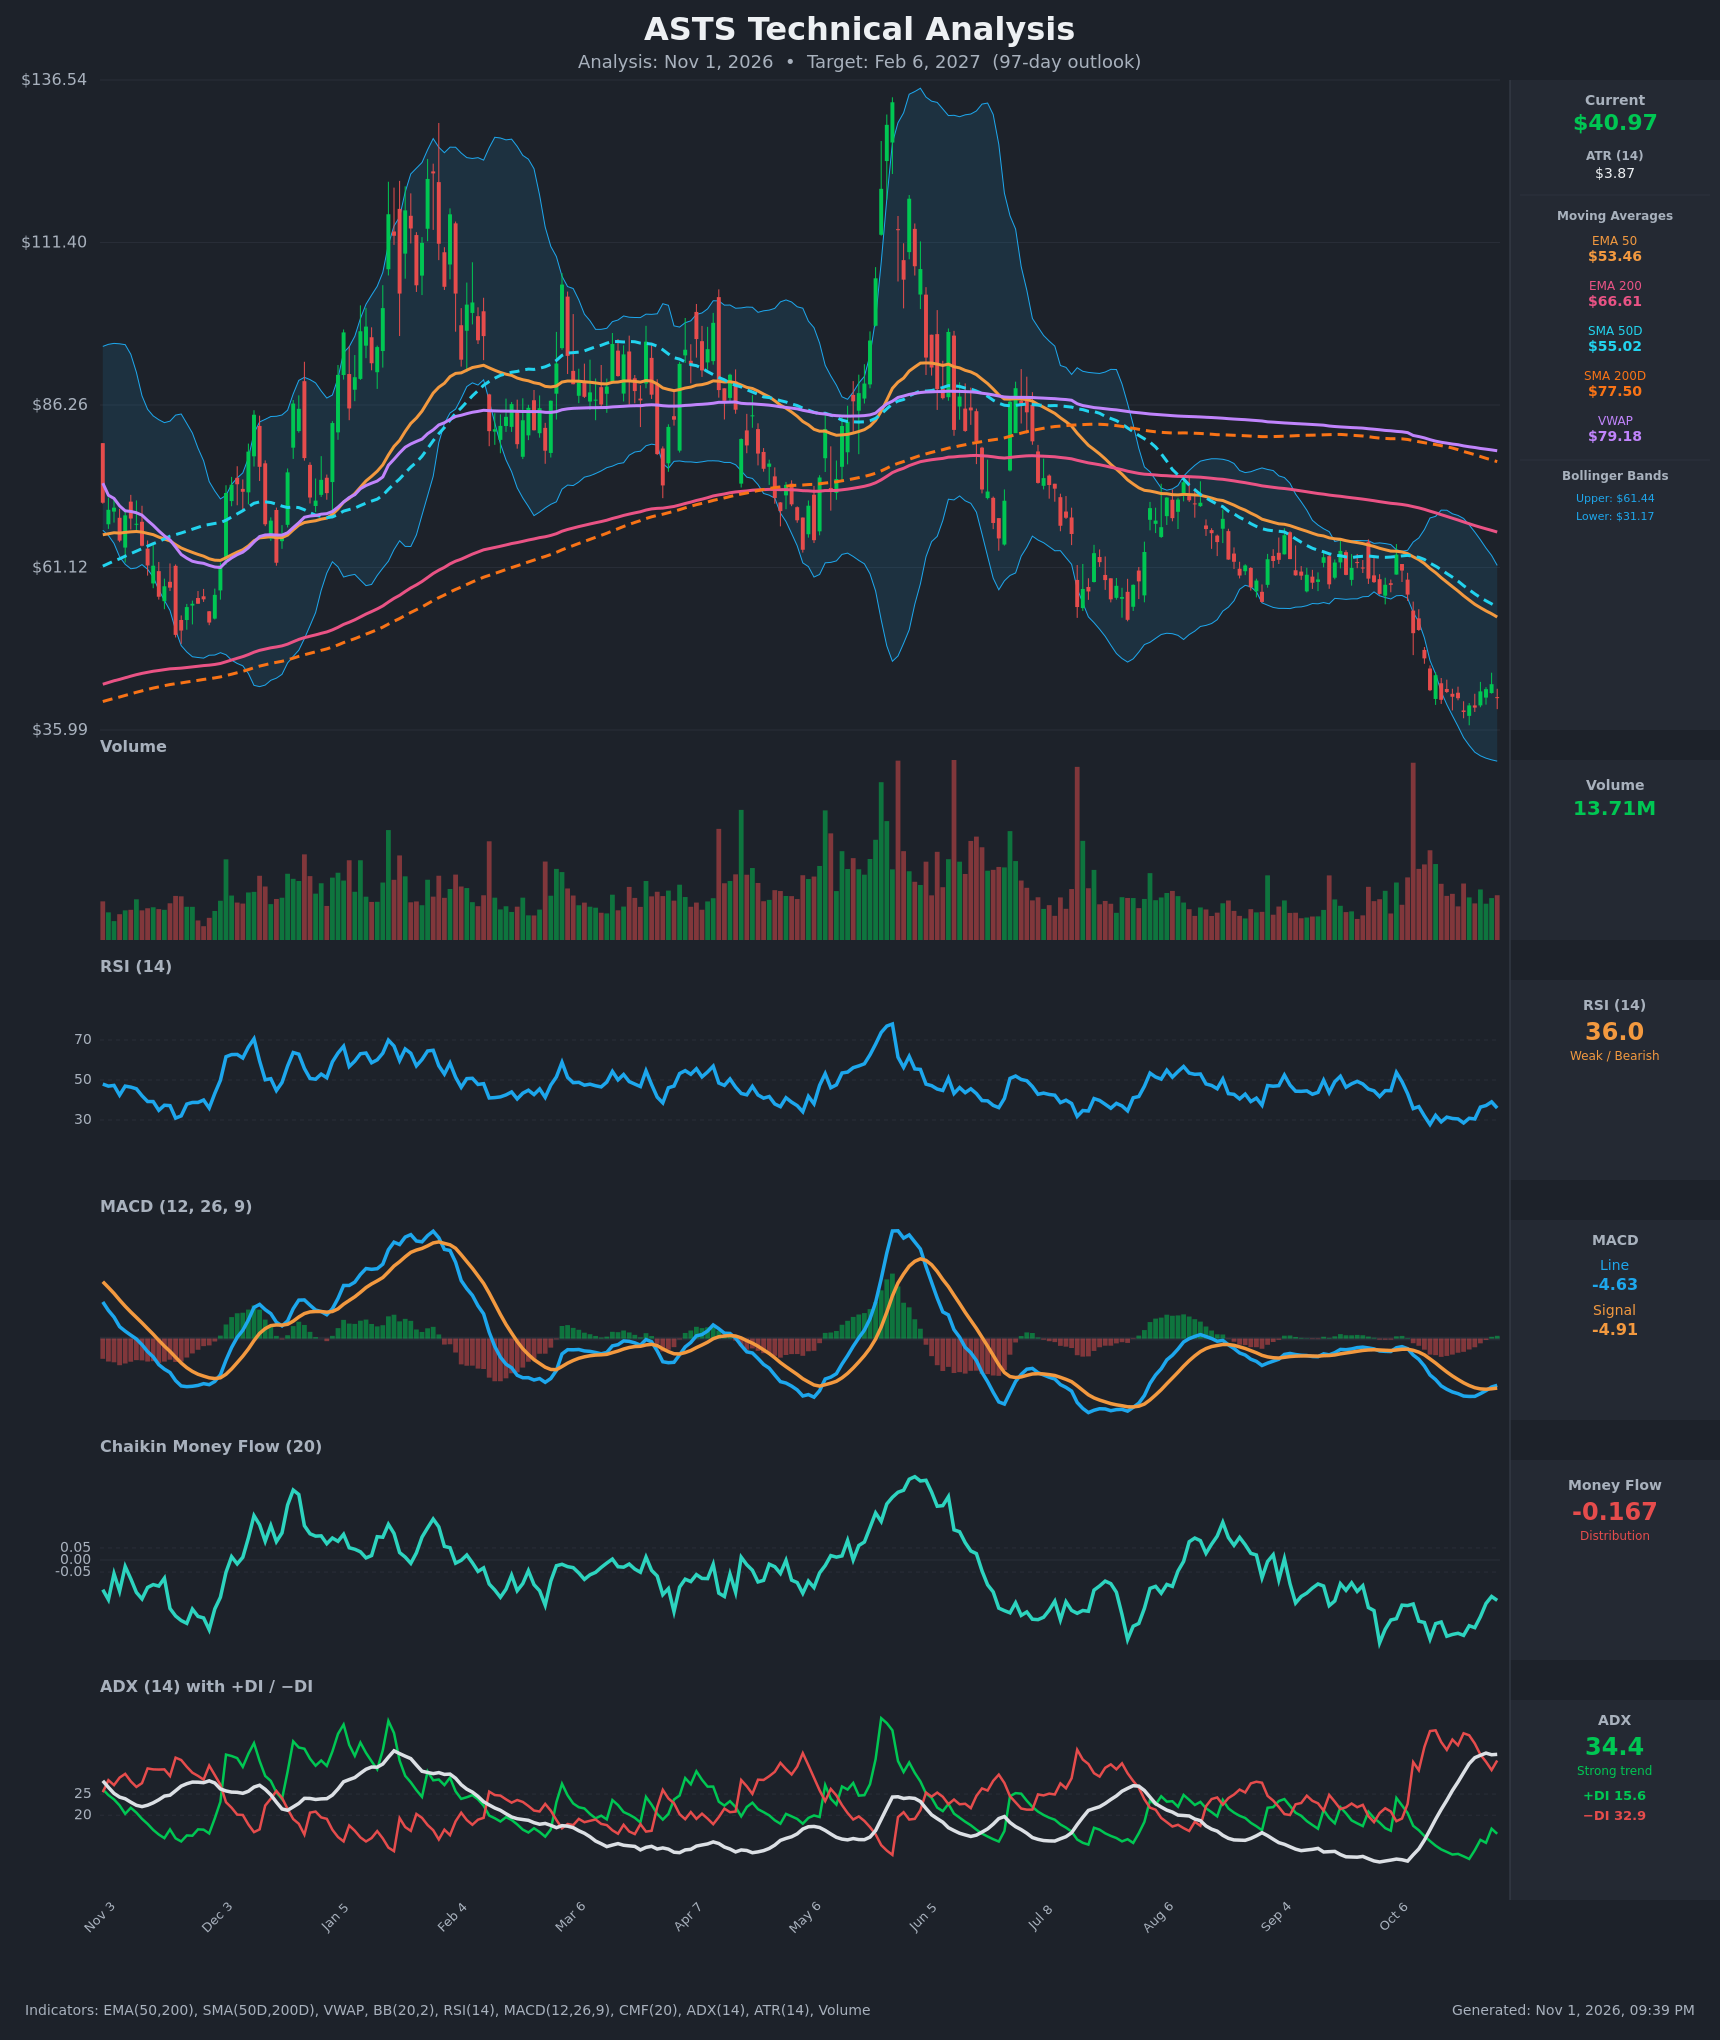
Analysis
TECHNICAL INDICATORS
- RSI (14): 35.98, up from a 27.7 low on Oct 14 but still below 40 and well under 50. It is bouncing out of oversold, which shows some easing of selling pressure, but it has not reclaimed the 40-50 zone where downtrend rallies usually stall. [Bearish]
- 20 EMA: No 20 EMA value was supplied. The EMA 50 at $53.46 is about 30% above price and falling, and the chart's short-term averages are also overhead. Price is far below every moving average, so they all act as resistance. [Bearish]
- MACD: Line -4.63 is above signal -4.91, a fresh bullish crossover on Oct 29-30. The histogram has turned slightly positive from deeply negative. This is a momentum-relief signal, but it sits far below zero and is typical of a bounce inside a downtrend. [Neutral]
- Bollinger Bands (20): Upper $61.44, lower $31.17, midline about $46.3. Price at $40.97 is below the midline in the lower half of the bands, after riding near the lower band during the breakdown. The bands are wide, which means high volatility, and the midline is falling. [Bearish]
- CMF (20): -0.167, well below -0.05. It has improved from -0.33 but remains in clear distribution, so selling pressure still dominates. [Distribution]
- ADX (14): 34.4 with −DI 32.9 above +DI 15.6. This is a strong, mature downtrend with bears firmly in control. ADX is flat at about 34, so the trend may be peaking in strength, and +DI has been ticking up from its lows. [Strong Trend – Bearish]
- Volume: 13.71M. Volume spiked on the Oct 12-14 breakdown candles and has since faded during the base-building. Recent small green candles on modest volume suggest a weak relief bounce rather than strong accumulation. [Bearish-leaning / Neutral]
DIVERGENCES & TRENDS
- Mild bullish divergence: price made lower lows (Oct 16 $40.66, Oct 22 $38.77) while RSI held at about 28-31 and MACD histogram improved, and the MACD line crossed above signal. This hints at fading downside momentum.
- Moving average structure is decisively bearish: price ($40.97) is below the EMA50 ($53.46), EMA200 ($66.61), SMA50D ($55.02), SMA200D ($77.50) and VWAP ($79.18). EMA50 is below EMA200 and SMA50D is below SMA200D, so the death-cross configuration is in place and all the averages are sloping down.
- The stock fell from the roughly $130 peak in late May to about $41, a drawdown of nearly 70%, with lower highs and lower lows since June.
- ADX has risen from about 12 to 34 as −DI took control, confirming that the decline is a real trend. +DI is turning up slightly, but it is still far below −DI.
- CMF has been mostly below zero since June and has not turned positive, so there is no accumulation signal yet.
CHART PATTERNS
- Primary structure: a long-term Bearish Head and Shoulders / Double Top on the macro chart. The January-February peak (~$125) and the May-June peak (~$130) form a double top, with a neckline break through the ~$60-65 area in the autumn. The decline continued below the neckline into the low $40s.
- Recent action: a small Bullish Falling Wedge / basing consolidation in the $38-44 range, with a MACD crossover. This is only a minor relief setup. A falling wedge needs a breakout above roughly $46-47 (the BB midline) with volume to confirm.
- Measured-move context: the double-top height of about $65-70 projected from the $62 neckline suggests a downside target of about $0-$ low-$mid 0s, which is not realistic. Practically, the next support zones are the Bollinger lower band ($31) and the $30-$35 area (the lower chart bound ~$36 and below).
- Overhead resistance is layered at $46-47 (BB midline), $53-55 (EMA50/SMA50D) and $61 (BB upper).
POTENTIAL SCENARIOS
- Scenario 1: Bearish Trend Continuation — The downtrend resumes after the relief bounce fades beneath the declining EMA50 and Bollinger midline. −DI stays dominant and CMF stays negative. Trigger: break below $38.77 (the Oct 22 low) on rising volume. Target: $31-$34 (lower Bollinger band), with an extension toward $28. Invalidation: daily close above $47 with CMF turning positive. (50% probability)
- Scenario 2: Neutral Basing Range — Price consolidates between about $33 and $48 as selling exhausts and the MACD crossover holds, with the falling wedge play stalling. Trigger: holding $36-$38 while RSI stays at 35-50. Target: $38-$44. Invalidation: close below $35 or above $50. (20% probability)
- Scenario 3: Bullish Oversold Relief Rally — A mean-reversion bounce lifts price toward the EMA50 and SMA50D as shorts cover and MACD rises toward zero. Trigger: close above $46-47 with expanding volume. Target: $53-$56. Invalidation: loss of $38 on a closing basis. (30% probability)
PRICE TARGETS
For a 97-day horizon, ATR of $3.87 (about 9.4% of price) and a trend that is strong and bearish but oversold both matter. The target sits modestly below the current price, reflecting continued trend pressure that is partly offset by the oversold bounce potential.
- Target Price: $37.00 (97 days)
- Expected Range: $28.00 to $50.00 (width $22.00, about 53.7% of current price. This is deliberately wider than the 18-30% guide because ASTS is highly volatile: ATR is about 9.4% of price, and the range is meant to capture both a drop to the lower band and a relief rally to the EMA50.)
- Key Levels: Support at $38.77 (recent swing low, then $31.17 lower Bollinger band), Resistance at $46.30 (Bollinger midline), then $53.46 (EMA50)
OVERALL BIAS
OVERALL BIAS: BEARISH - All major moving averages are above price and falling, the death-cross configuration is intact, ADX is 34 with −DI far above +DI, and CMF shows persistent distribution. The MACD crossover and oversold RSI bounce are likely to produce only a relief rally into overhead resistance before the downtrend resumes toward the lower Bollinger band.
This is educational analysis and not financial advice.