META 97-day bearish forecast — Nov 1, 2026
- Bias: Bearish
- Timeframe: 97 days (made Nov 1, 2026, target date Feb 5, 2027)
- Price at analysis: $614.99
- Price target: $585.00
- Expected range: $510.00 – $670.00
- Result: Pending — graded after the close on Feb 5, 2027
Get a free AI analysis of META today
Analysis
TECHNICAL INDICATORS
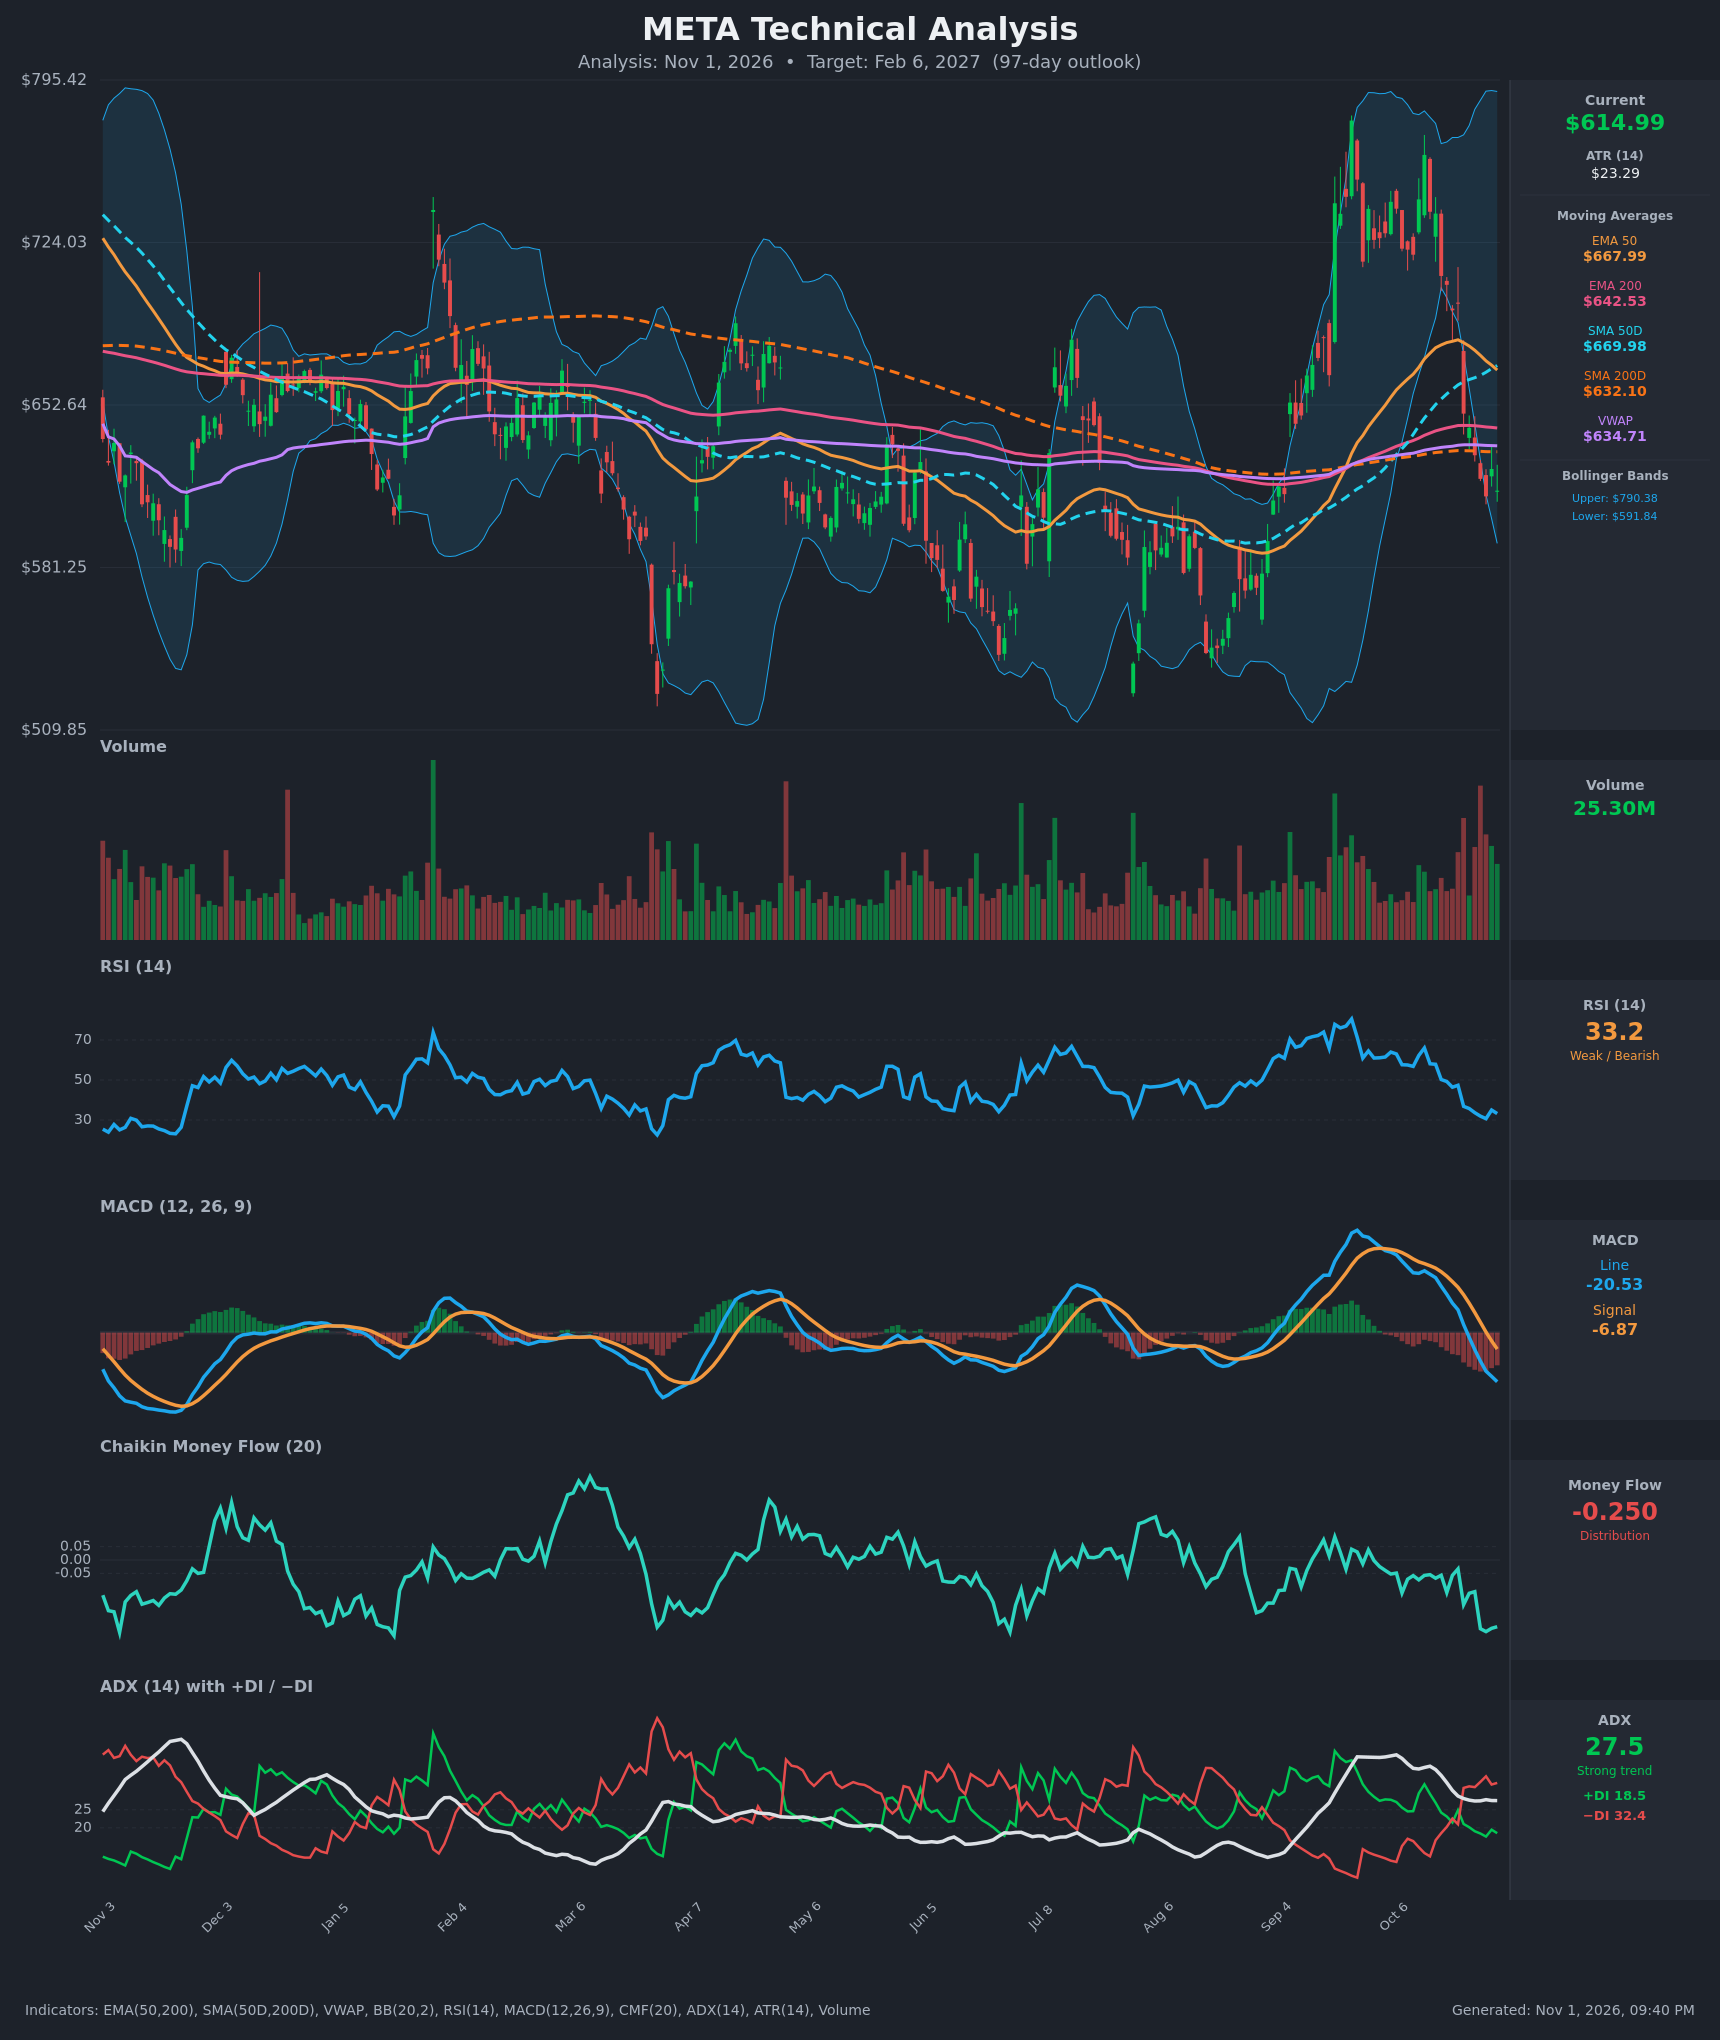
- RSI (14): 33.21, just above the oversold line at 30. It has fallen from 66 on Oct 13 to the low 30s, with a small bounce to 35 on Oct 29 that failed. Momentum is clearly weak but close to oversold, so a relief bounce is possible. [Bearish]
- 20 EMA: The 20 EMA is not provided. The EMA 50 is $667.99 and the price of $614.99 is about 8% below it, which makes it overhead resistance. The EMA 50 has been falling since Oct 21, and a 20 EMA would be well above price. [Bearish]
- MACD: The MACD line (-20.53) is below the signal line (-6.87), and the histogram is about -13.7 and widening. The bearish crossover occurred around Oct 23, and both lines are now below zero. Downside momentum is still accelerating. [Bearish]
- Bollinger Bands (20): The upper band is $790.38 and the lower band is $591.84. The bands are very wide after the September-October spike. Price sits in the lower part of the range, about $23 above the lower band, and has moved down from the upper half within about 3 weeks. A band walk toward the lower band is possible, and the wide bands imply high volatility. [Bearish]
- CMF (20): -0.250, well below the -0.05 threshold. It has been negative for the whole 15-bar window and has deepened from about -0.06 to -0.25 over the last 8 sessions. This indicates heavy distribution. [Distribution]
- ADX (14): 27.5 with -DI (32.4) well above +DI (18.5). The -DI crossed above +DI on Oct 20-22. ADX has eased from 37 but is still above 25, so the downtrend has established strength. [Strong Trend – Bearish]
- Volume: 25.30M, with high-volume red candles in the recent decline (a large spike near the end of October). Selling on heavy volume confirms the distribution that CMF shows. There is no sign of capitulation reversal yet. [Bearish confirmation]
DIVERGENCES & TRENDS
- No bullish RSI or MACD divergence is visible. MACD is making new lows along with price, so momentum confirms the decline.
- The EMA 50 ($667.99) is converging toward the SMA 50D ($669.98) and is falling, while price has dropped below both. The EMA 50 is still above the EMA 200 ($642.53), and the SMA 50D is above the SMA 200D ($632.10), so there is no death cross yet. The EMA 50 is about 4% above the EMA 200, and a bearish cross is possible within weeks if the decline continues.
- Price ($614.99) is now below the SMA 200D ($632.10), the EMA 200 ($642.53) and VWAP ($634.71). Together these form a cluster of overhead resistance at about $632-$643, and it is a significant breakdown below long-term trend support.
- The earlier lows at about $510-$560 (March-April and Aug-Sep) are the next major support zone below.
- ADX has been dropping from 37 and +DI/-DI have fully flipped, so the new trend is bearish.
CHART PATTERNS
- Bearish Head and Shoulders / Double Top (loose): The September-October rally to about $790 (peak around Oct 13 at $762) followed by a sharp drop looks like a failed breakout and sharp reversal. It is not a clean pattern from the reference diagram, but the lower high from the earlier rally supports a bearish reversal bias.
- Broader range: Over the past year the price has ranged between roughly $510 and $790, with the lower half supported at $510-$560. The current breakdown through the $632-$643 moving average cluster targets the lower half of that range.
- Targets: The measured downside from the failed breakout points to roughly $560-$580 (the Jul-Aug lows area and lower Bollinger). An extension toward $510-$530 is possible in a stronger sell-off.
POTENTIAL SCENARIOS
- Scenario 1: Bearish Continuation Toward Prior Lows — Price remains below the SMA 200D and EMA 200 cluster with -DI dominant and CMF in distribution, and a possible death cross forms in coming weeks. Trigger: a daily close below $591.84 (lower Bollinger) and the $590 area. Target: $540-$570. Invalidation: a daily close above $645 (the EMA 200/VWAP cluster). (50% probability)
- Scenario 2: Neutral/Bullish Oversold Bounce and Range — RSI near 30 and the wide bands trigger a relief rally into the moving-average resistance cluster, then price rolls over and chops. Trigger: RSI holds above 30 with a MACD histogram turning up. Target: $635-$660. Invalidation: a close below $590. (30% probability)
- Scenario 3: Bullish Reclaim and Recovery — Strong buying returns, price reclaims the SMA 200D and EMA 50 and the previous uptrend resumes. Trigger: close above $670 with CMF turning positive. Target: $700-$730. Invalidation: rejection at $645 and a close below $600. (20% probability)
PRICE TARGETS
For the 97-day timeframe (range width guidance 18-30%):
- Target Price: $585.00 (for the 97-day horizon)
- Expected Range: $510.00 to $670.00 (width $160 = about 26% of the current price, in line with the 61-180 day guidance)
- Key Levels: Support at $591.84 (lower Bollinger; then $540-$560), Resistance at $632.10 (SMA 200D; then $642.53 EMA 200)
OVERALL BIAS
OVERALL BIAS: BEARISH - Price has broken below the SMA 200D, EMA 200 and VWAP with MACD below signal and falling, -DI dominating a strong ADX, CMF at -0.25 and heavy-volume selling. An oversold bounce is possible, but the weight of evidence points to lower prices over the 97-day horizon.
This is educational analysis and not financial advice.