MU 97-day bearish forecast — Nov 1, 2026
- Bias: Bearish
- Timeframe: 97 days (made Nov 1, 2026, target date Feb 5, 2027)
- Price at analysis: $884.74
- Price target: $840.00
- Expected range: $730.00 – $960.00
- Result: Pending — graded after the close on Feb 5, 2027
Get a free AI analysis of MU today
Analysis
TECHNICAL INDICATORS
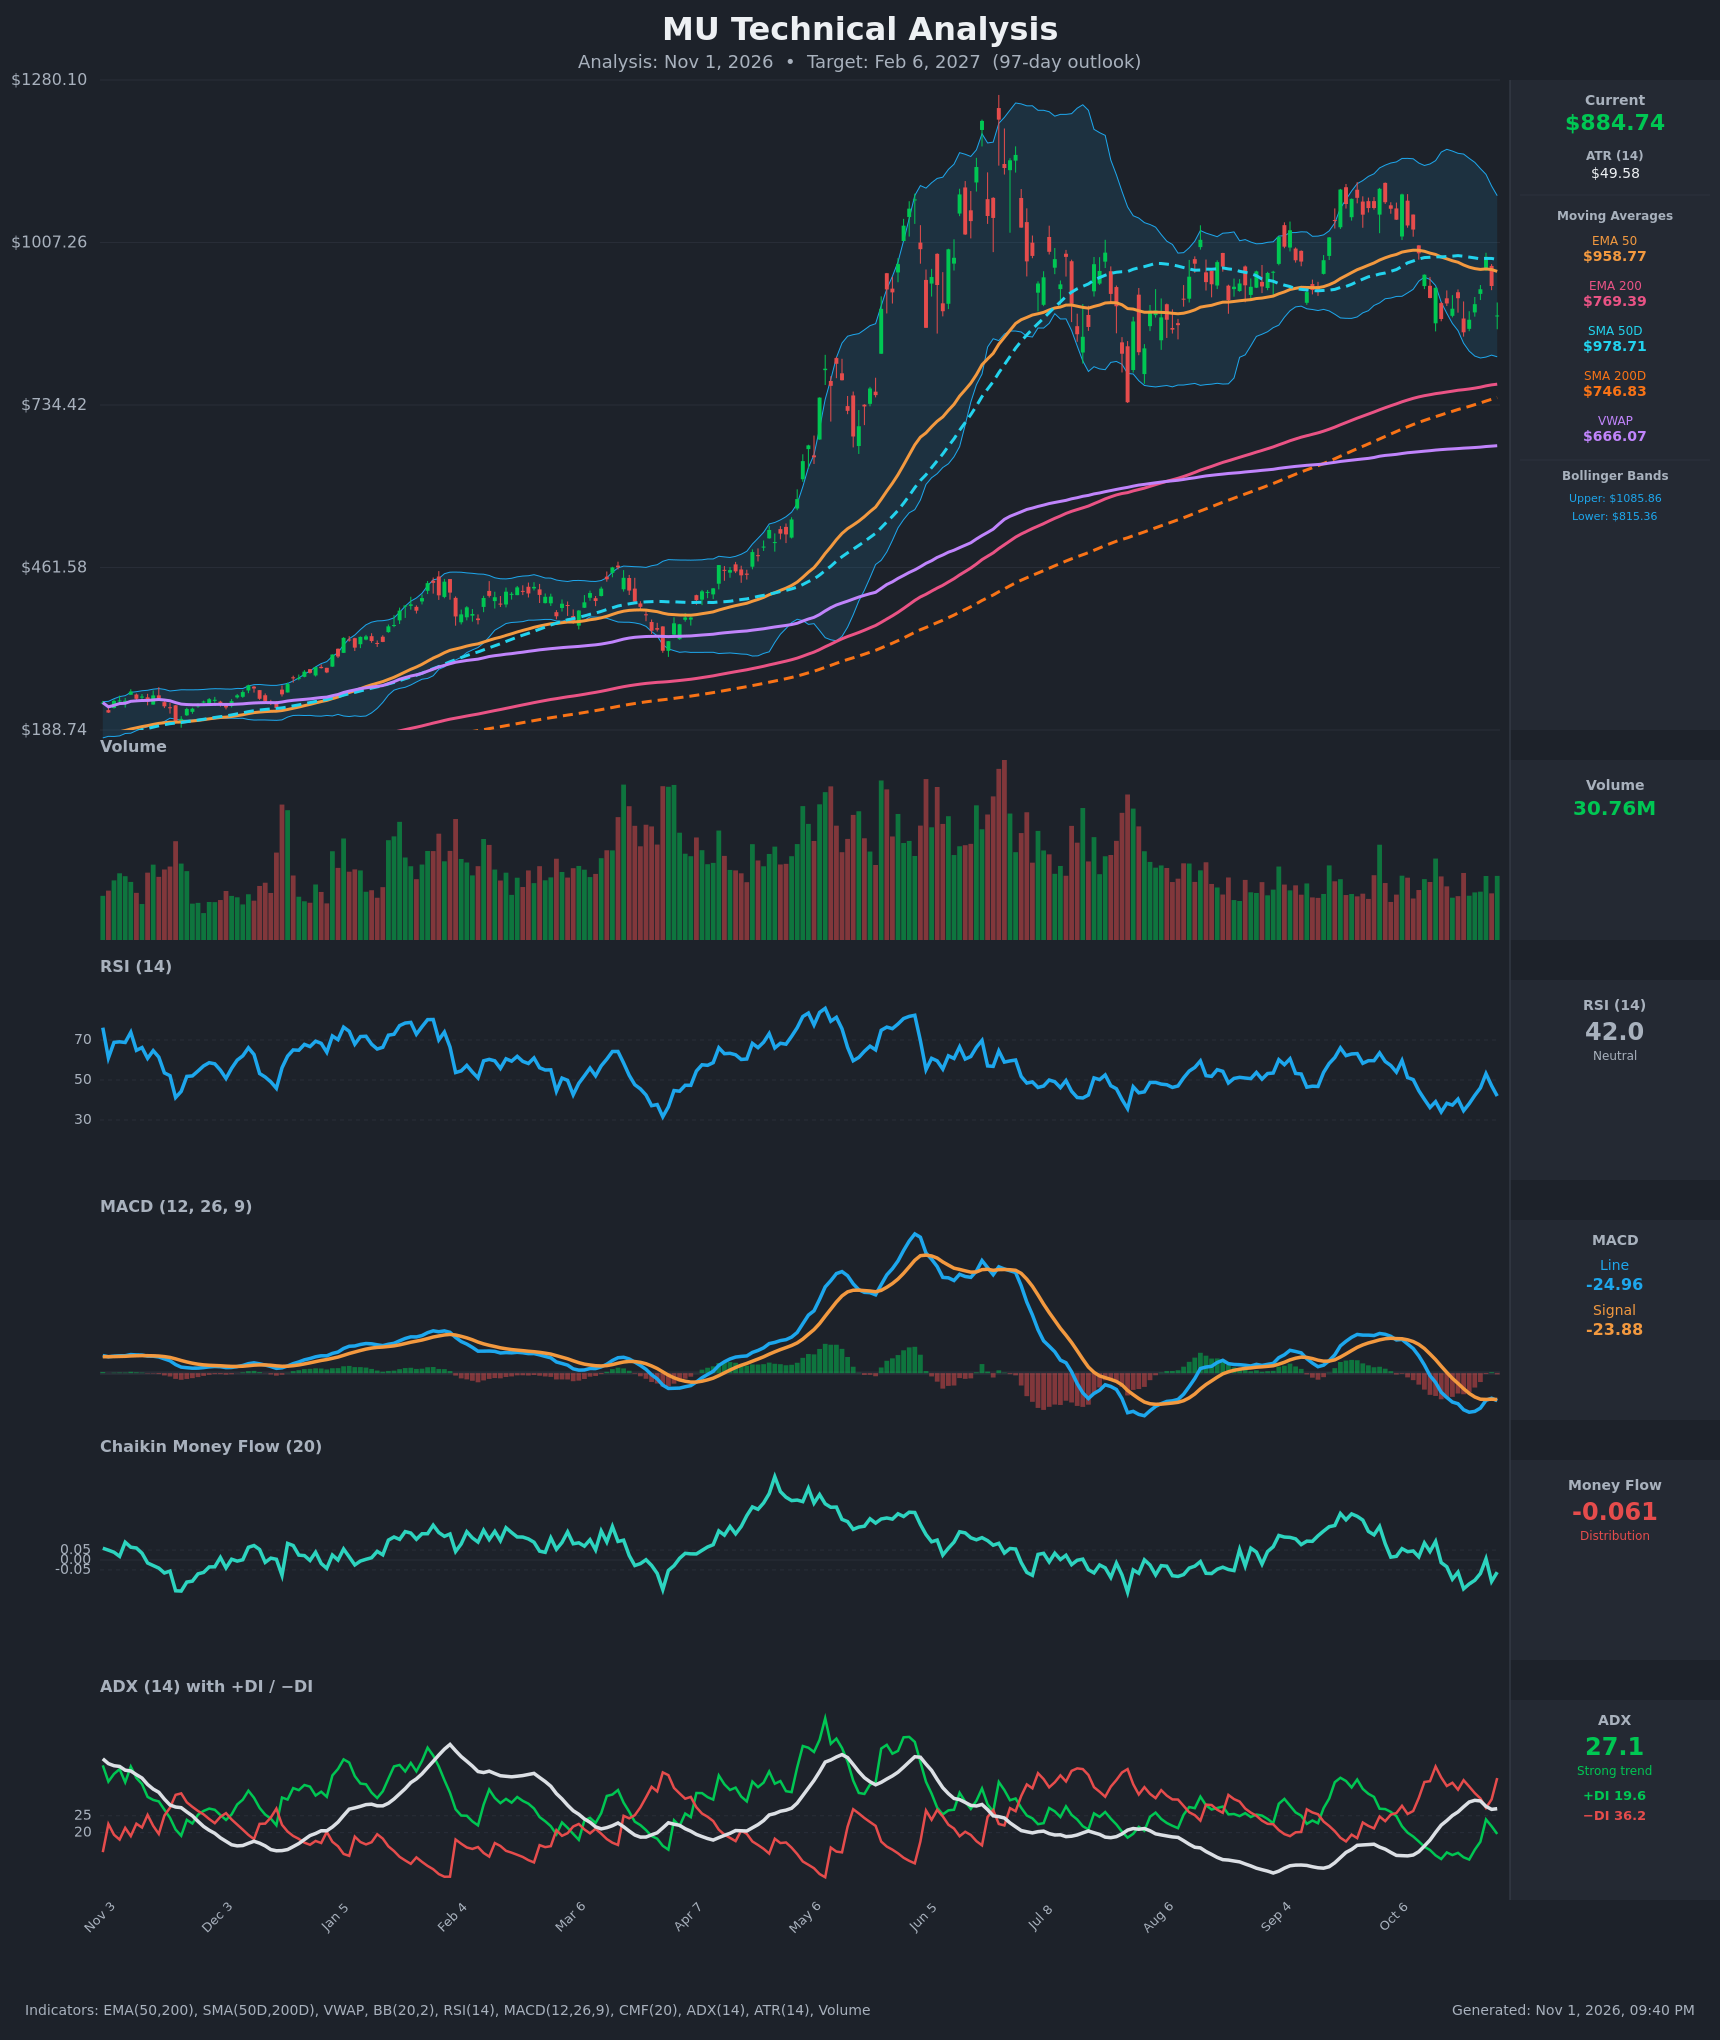
- RSI (14): 41.98, down from 53.2 on Oct 28 and near the 34–38 zone hit on Oct 16 and Oct 22. It is below 50 but not oversold, so there is room to fall further. Rallies have stalled below 50–53. [Bearish]
- 20 EMA: The chart shows no 20 EMA. The EMA 50 at $958.77 is the nearest proxy, and price at $884.74 is about 7.7% below it. It is sloping down and acting as resistance. EMA 200 at $769.39 is the major support, about 13% below. [Bearish]
- MACD: Line −24.96 versus signal −23.88, so the line is below the signal with a slightly negative histogram of about −1.1. The line tried to cross back up on Oct 28 (−24.64 vs −23.83) and failed, then rolled over again. Both lines are below zero, which means bearish momentum. [Bearish]
- Bollinger Bands (20): Upper $1085.86, lower $815.36, midline about $950. Price sits in the lower half, roughly 26% of the band width above the lower band. The bands are wide, so volatility is elevated. Price has been rejected at the midline and could test the lower band. [Bearish]
- CMF (20): −0.061, below the −0.05 threshold, after a brief spike to +0.006 on Oct 28. It has been negative on most bars since Oct 16, which signals distribution. [Distribution]
- ADX (14): 27.1 with +DI 19.6 and −DI 36.2. ADX rose from 14 to about 29.6 and is now easing. A reading above 25 means a trend is in place, and −DI has been well above +DI the whole period. Sellers control the current trend. [Strong Trend – Bearish]
- Volume: 30.76M, in the lower-to-middle part of the past year's range and well below the May–July peaks. The sell-off is not capitulation-level. Declines have come on equal or slightly heavier volume than bounces, so there is no sign of a washout bottom. [Neutral to mildly Bearish]
DIVERGENCES & TRENDS
- No clear divergence. RSI made a lower low near 34–35 on Oct 16 and Oct 22 as price made lower lows, so momentum confirmed price. The Oct 28 bounce to 53 RSI faded quickly.
- Short-term trend is down. Price is below EMA 50 ($958.77) and SMA 50 ($978.71) and has made lower highs since the June peak near $1,250.
- Long-term trend is still up. Price is above EMA 200 ($769.39) and SMA 200 ($746.83). EMA 50 is above EMA 200 and SMA 50 is above SMA 200, so there is no death cross. The 50/200 gaps are narrowing, though, because the 50s are rolling over.
- VWAP is far below price at $666.07, so the longer-term anchored buyers are deeply in profit. That leaves room for profit-taking.
- MACD has been below its signal since mid-October. It is now below zero as well, and the Oct 28 rebound attempt failed.
- Directional movement: −DI has stayed above +DI throughout the last 15 bars, widening to 36.2 versus 19.6 on Oct 30.
CHART PATTERNS
- Possible Bearish Head and Shoulders (tentative): The June spike near $1,250 is the head and the lower high near $1,090–$1,100 in Sep/Oct is a right shoulder. The left shoulder is poorly defined, so confidence is moderate. The neckline would be near the July low of about $735. A break below it would target the $600s, but that is outside the base case for 97 days.
- Lower-high consolidation / broad range: Since July, price has ranged from about $735 to $1,100 with lower highs. This resembles a loose Bearish Expanding or Descending structure, and the pattern leans bearish while price stays below the 50-day averages.
- Support confluence zone at $747–$770 (SMA 200 and EMA 200) is where a pullback would likely be tested. The lower Bollinger Band at $815 is the first stop.
- Resistance cluster at $959–$979 (EMA 50 and SMA 50). A reclaim would negate the bearish pattern and could signal a flag or range-bound continuation.
POTENTIAL SCENARIOS
- Scenario 1: Bearish Pullback to the 200-Day Zone — Sellers stay in control (−DI far above +DI, MACD negative, CMF in distribution). Price loses the $815 lower band and drifts toward the rising 200-day averages, where dip buyers should step in. Trigger: daily close below $815. Target: $770–$800, with a 97-day close near $840 after some stabilization. Invalidation: a daily close above $979 (SMA 50). (50% probability)
- Scenario 2: Neutral Range Consolidation — Price chops between the lower band and the 50-day averages while ADX fades and the MAs converge toward price. Trigger: holds $815–$960 with MACD flattening. Target: $850–$950. Invalidation: close below $770 or above $1,000. (25% probability)
- Scenario 3: Bullish Reclaim and Recovery — Buyers defend $815–$850, RSI turns up through 50 and MACD crosses up, driving a reclaim of the 50-day averages. Trigger: close above $979 with CMF above +0.05. Target: $1,050–$1,100 (upper band and prior highs). Invalidation: close back below $880 after the breakout attempt. (25% probability)
PRICE TARGETS
- Target Price: $840.00 (97-day horizon, about 5% below current)
- Expected Range: $730.00 to $960.00 (width $230, about 26% of current price, consistent with the 18–30% guidance for 61–180 days)
- Key Levels: Support at $815.36 (lower Bollinger Band; deeper support at $769.39 EMA 200 and $746.83 SMA 200), Resistance at $958.77 (EMA 50; then $978.71 SMA 50)
OVERALL BIAS
OVERALL BIAS: BEARISH - Price is below the 50-day averages with −DI far above +DI at ADX 27, MACD is negative and below its signal, and CMF shows distribution. The long-term uptrend and the 200-day cluster near $750–$770 should cushion any decline, so the target is a moderate pullback to $840 rather than a collapse.
This is educational analysis and not financial advice.