USO 97-day bullish forecast — Nov 1, 2026
- Bias: Bullish
- Timeframe: 97 days (made Nov 1, 2026, target date Feb 5, 2027)
- Price at analysis: $168.83
- Price target: $176.00
- Expected range: $152.00 – $192.00
- Result: Pending — graded after the close on Feb 5, 2027
Get a free AI analysis of USO today
Analysis
TECHNICAL INDICATORS
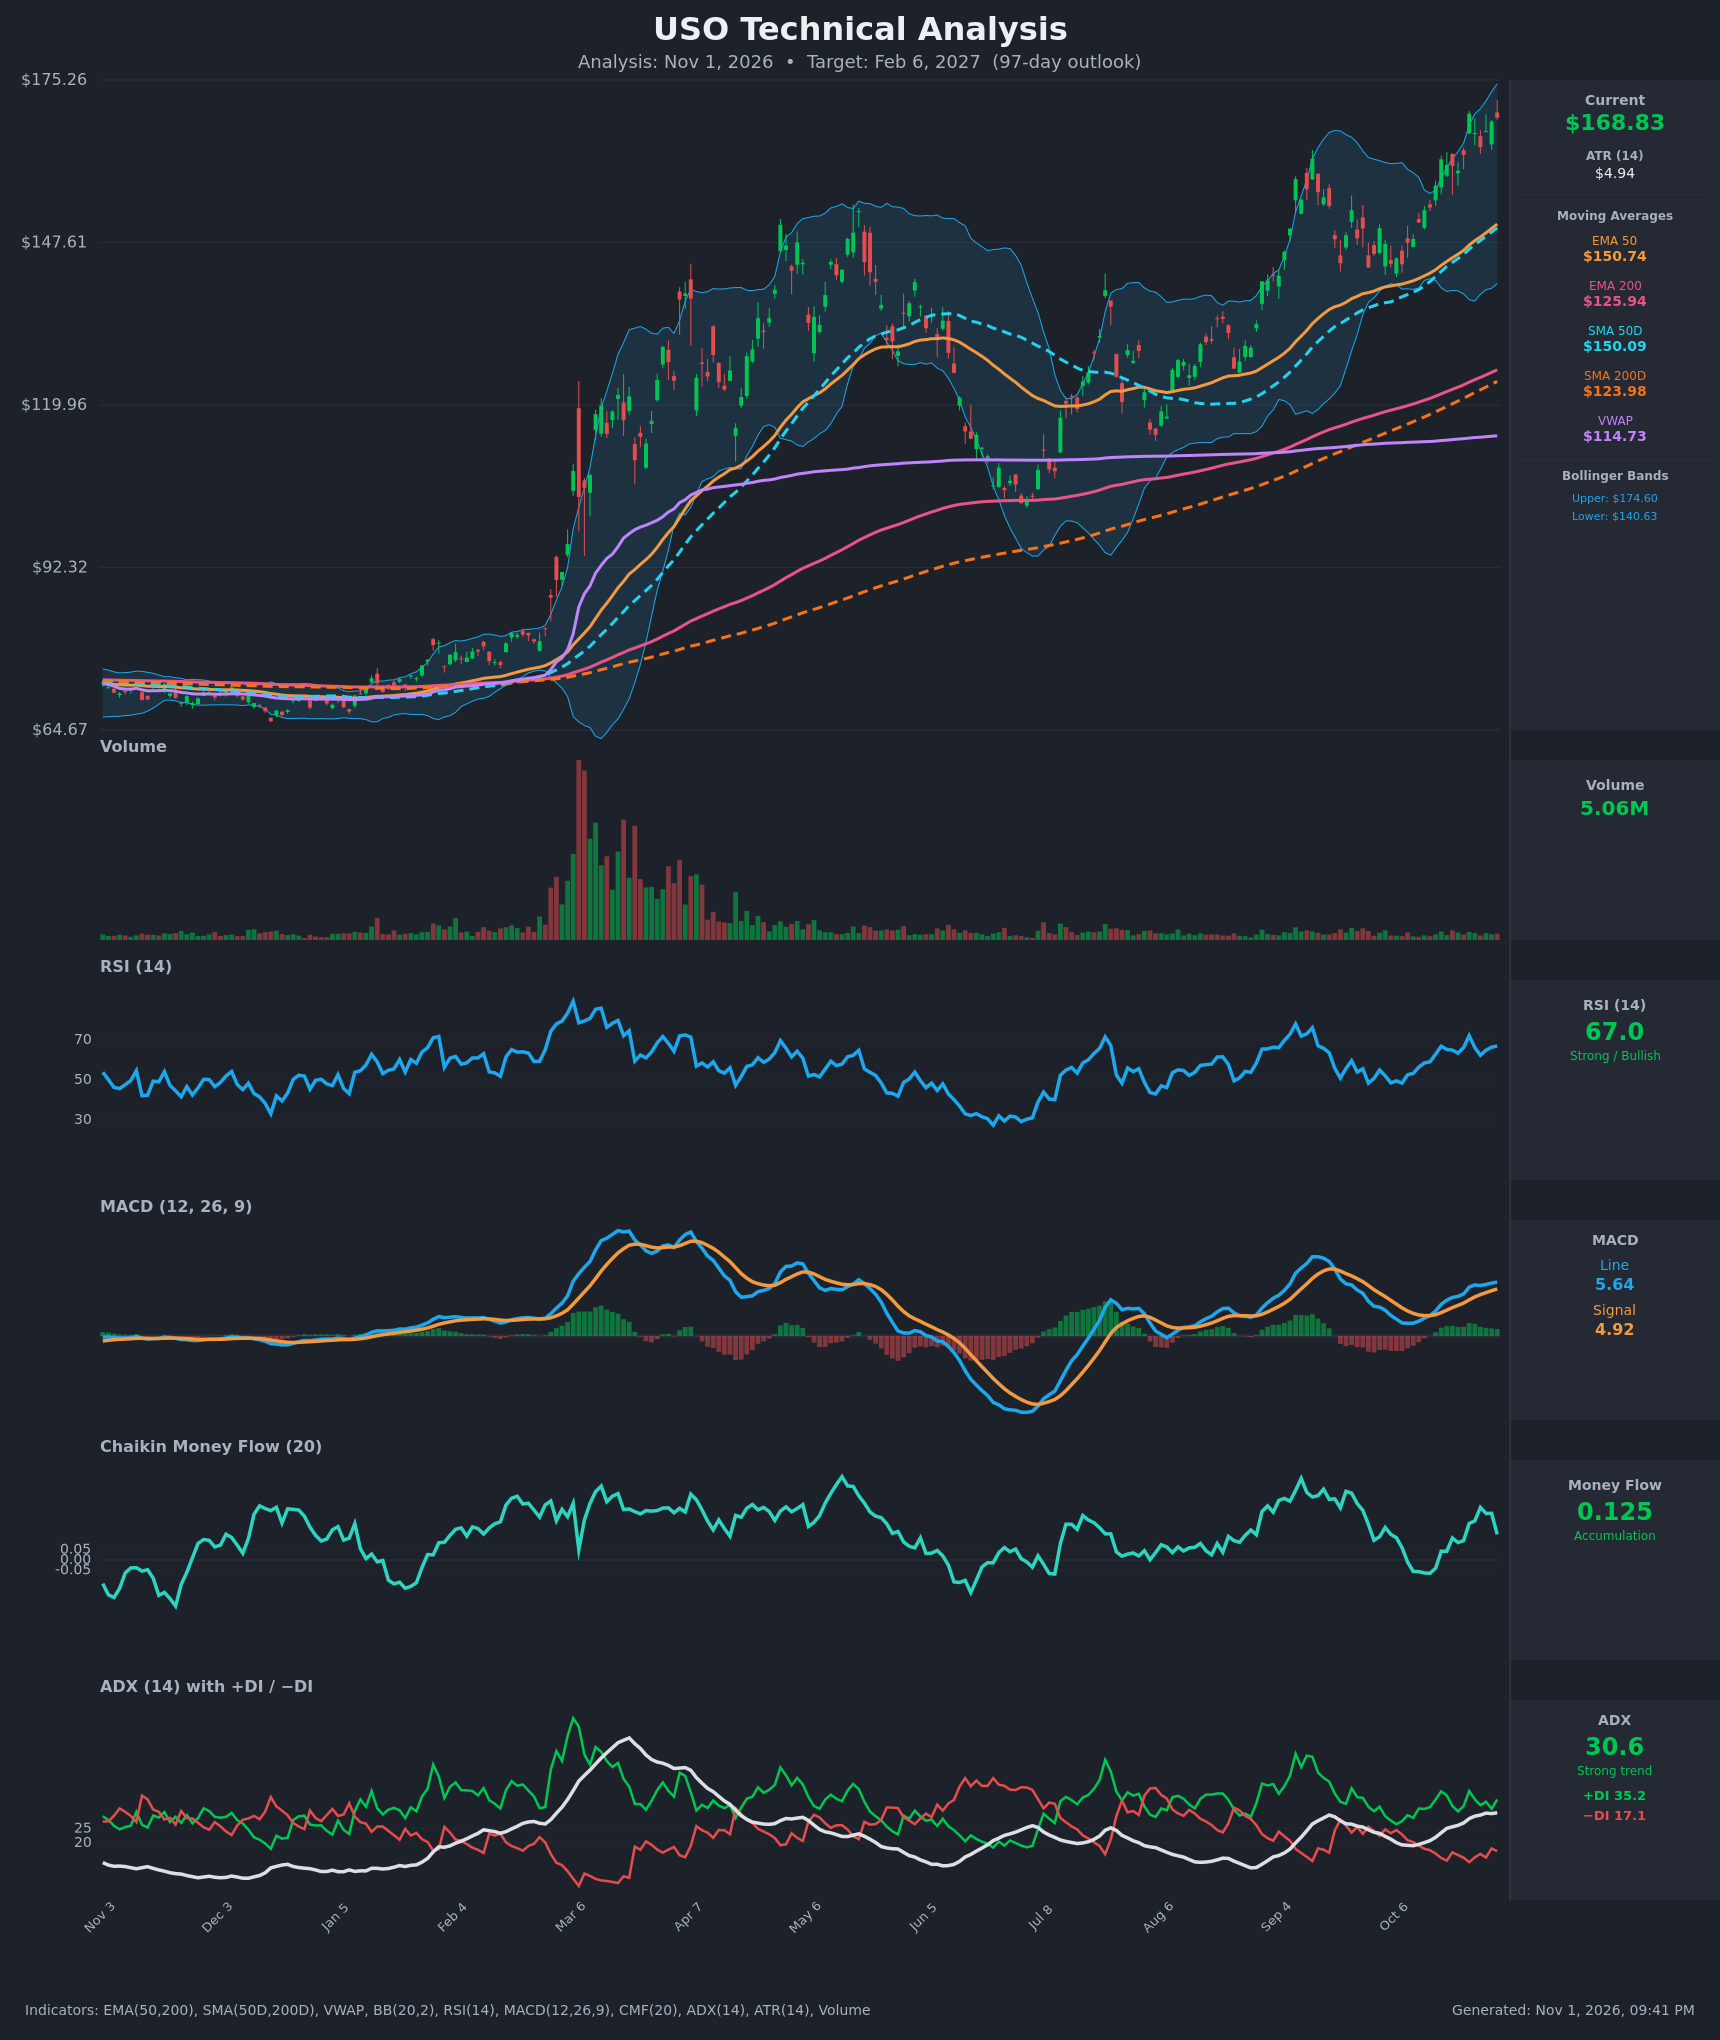
- RSI (14): 67.0, in the upper-bullish zone but just below 70. It peaked at 72.2 on Oct 23 (price $169.53) and is now slightly lower at nearly the same price, a mild momentum fade. Momentum is still positive and has risen from 56 on Oct 12. [Bullish]
- 20 EMA: Not supplied, so I use the EMA 50 at $150.74 as the trend gauge. Price is about 12% above it and the EMA is rising steadily, so it acts as dynamic support. The gap is stretched, which raises the risk of a mean-reversion pullback. [Bullish]
- MACD: Line 5.64 is above signal 4.92, a histogram of about +0.72 that has widened over recent bars. The line crossed above the signal around Oct 15 and has stayed above it since. Both lines are well above zero. [Bullish]
- Bollinger Bands (20): Upper $174.60, lower $140.63, so the mid-band is about $157.60. Price at $168.83 sits in the upper quarter of the band, "walking the band" in a strong trend. Bands are wide, which reflects high volatility. A close above $174.60 would signal a breakout extension. [Bullish]
- CMF (20): 0.125, above the +0.05 threshold and positive since Oct 16, so buying pressure is present. It has eased from 0.256 (Oct 27) and dipped on the last bar, so accumulation is cooling. [Accumulation]
- ADX (14): 30.6 and rising from 19.5 on Oct 12, with +DI 35.2 well above −DI 17.1. This is a strong, maturing uptrend with bulls firmly in control. [Strong Trend – Bullish]
- Volume: 5.06M, flat to modest and far below the March spike. The advance is not driven by climactic volume, so there is no sign of blow-off exhaustion, but no strong expansion confirms the breakout either. VWAP at $114.73 is far below price, so most volume-weighted holders are in profit. [Neutral-to-Mildly Supportive]
DIVERGENCES & TRENDS
- Moving average structure: Price ($168.83) is above EMA50 ($150.74), EMA200 ($125.94), SMA50D ($150.09) and SMA200D ($123.98). SMA50D is well above SMA200D (the golden cross is long established) and EMA50 is above EMA200. All averages are rising, which confirms a long-term uptrend. There were no new crossovers in the last 15 bars.
- Minor bearish RSI divergence: Price is almost the same as on Oct 23 ($168.83 vs $169.53), but RSI is 67.0 vs 72.2. This suggests slowing momentum, not a reversal.
- MACD: The histogram is expanding positive, and the line made a higher high versus the September peak, which is confirming.
- ADX/DI: ADX has risen from below 20 to above 30, and +DI has stayed above −DI throughout. The trend is strengthening, though ADX around 30 can precede consolidation.
- CMF: It has stayed positive and is only moderately off its highs, so there is no distribution signal.
- Overextension: Price is about 12% above the 50-day averages and about 36% above the 200-day averages. Past rallies on this chart (March, September) were followed by sharp mean reversions, so pullback risk is real even within an uptrend.
CHART PATTERNS
- Bullish Flag / rising-channel breakout (continuation): Since August the price built a staircase of higher lows ($137 area in October) and higher highs, consolidating between the mid and upper Bollinger Bands before pushing to new highs. This resembles the Bullish Flag Pattern from the reference, with a breakout above the prior $169.53 swing high. The measured move projects roughly $180–$190.
- Higher-high/higher-low trend structure: The long-term setup is the large base from the $65–$75 range, followed by the March spike, a pullback to the $100 area, and a new higher high now. This is a classic bull-trend sequence.
- Caution pattern: The pair of highs near $169.5 and $168.8 with RSI lower on the second could become a Bearish Double Top if price loses roughly $159.80 (the Oct 21 close) and then $150. That is the minority case for now.
POTENTIAL SCENARIOS
- Scenario 1: Bullish Trend Continuation — The strong ADX and +DI dominance, positive MACD and accumulation CMF carry price through the upper Bollinger Band and the $175 high, in line with the flag measured move. Trigger: daily close above $175.30 on rising volume. Target: $180–$190. Invalidation: close below $159.80, then the $157 mid-band. (50% probability)
- Scenario 2: Neutral Consolidation / Pullback to the Mean — Price is overextended, so it digests gains by retracing toward the mid-Bollinger Band and the rising EMA50/SMA50D before resuming. Trigger: rejection at $174.60 and RSI rolling over under 60. Target: $150–$165. Invalidation: a close above $175.30. (30% probability)
- Scenario 3: Bearish Reversal — Momentum divergence plays out, the double top completes and price breaks the rising averages, repeating the earlier mean-reversion legs. Trigger: close below $150 (EMA50/SMA50D) with MACD crossing below signal and CMF below −0.05. Target: $135–$140, then the $125 EMA200. Invalidation: reclaim of $160. (20% probability)
PRICE TARGETS
Timeframe: 97 days (Feb 6, 2027). Current price $168.83.
- Target Price: $176.00
- Expected Range: $152.00 to $192.00 (width $40, about 23.7% of current price, in line with the 18-30% guidance for 61-180 days. ATR of $4.94 supports a wide range.)
- Key Levels: Support at $159.80, Resistance at $175.30
OVERALL BIAS
OVERALL BIAS: BULLISH - Price is above all key moving averages with a strong ADX of 30.6 and +DI far above −DI. MACD is positive and expanding, CMF shows accumulation, and the pattern is a bullish flag continuation. The stretched RSI/Bollinger position and the mild momentum divergence argue for a modest target and a wide range, with pullbacks toward $160 possible along the way.
This is educational analysis and not financial advice.