INTC 4-day bullish forecast — Nov 7, 2026
- Bias: Bullish
- Timeframe: 4 days (made Nov 7, 2026, target date Nov 10, 2026)
- Price at analysis: $56.34
- Price target: $57.40
- Expected range: $55.00 – $58.50
- Result: Correct (+3.2%) — closed at $58.13 on Nov 10, 2026; quality score 100/100
Get a free AI analysis of INTC today
Analysis
TECHNICAL INDICATORS
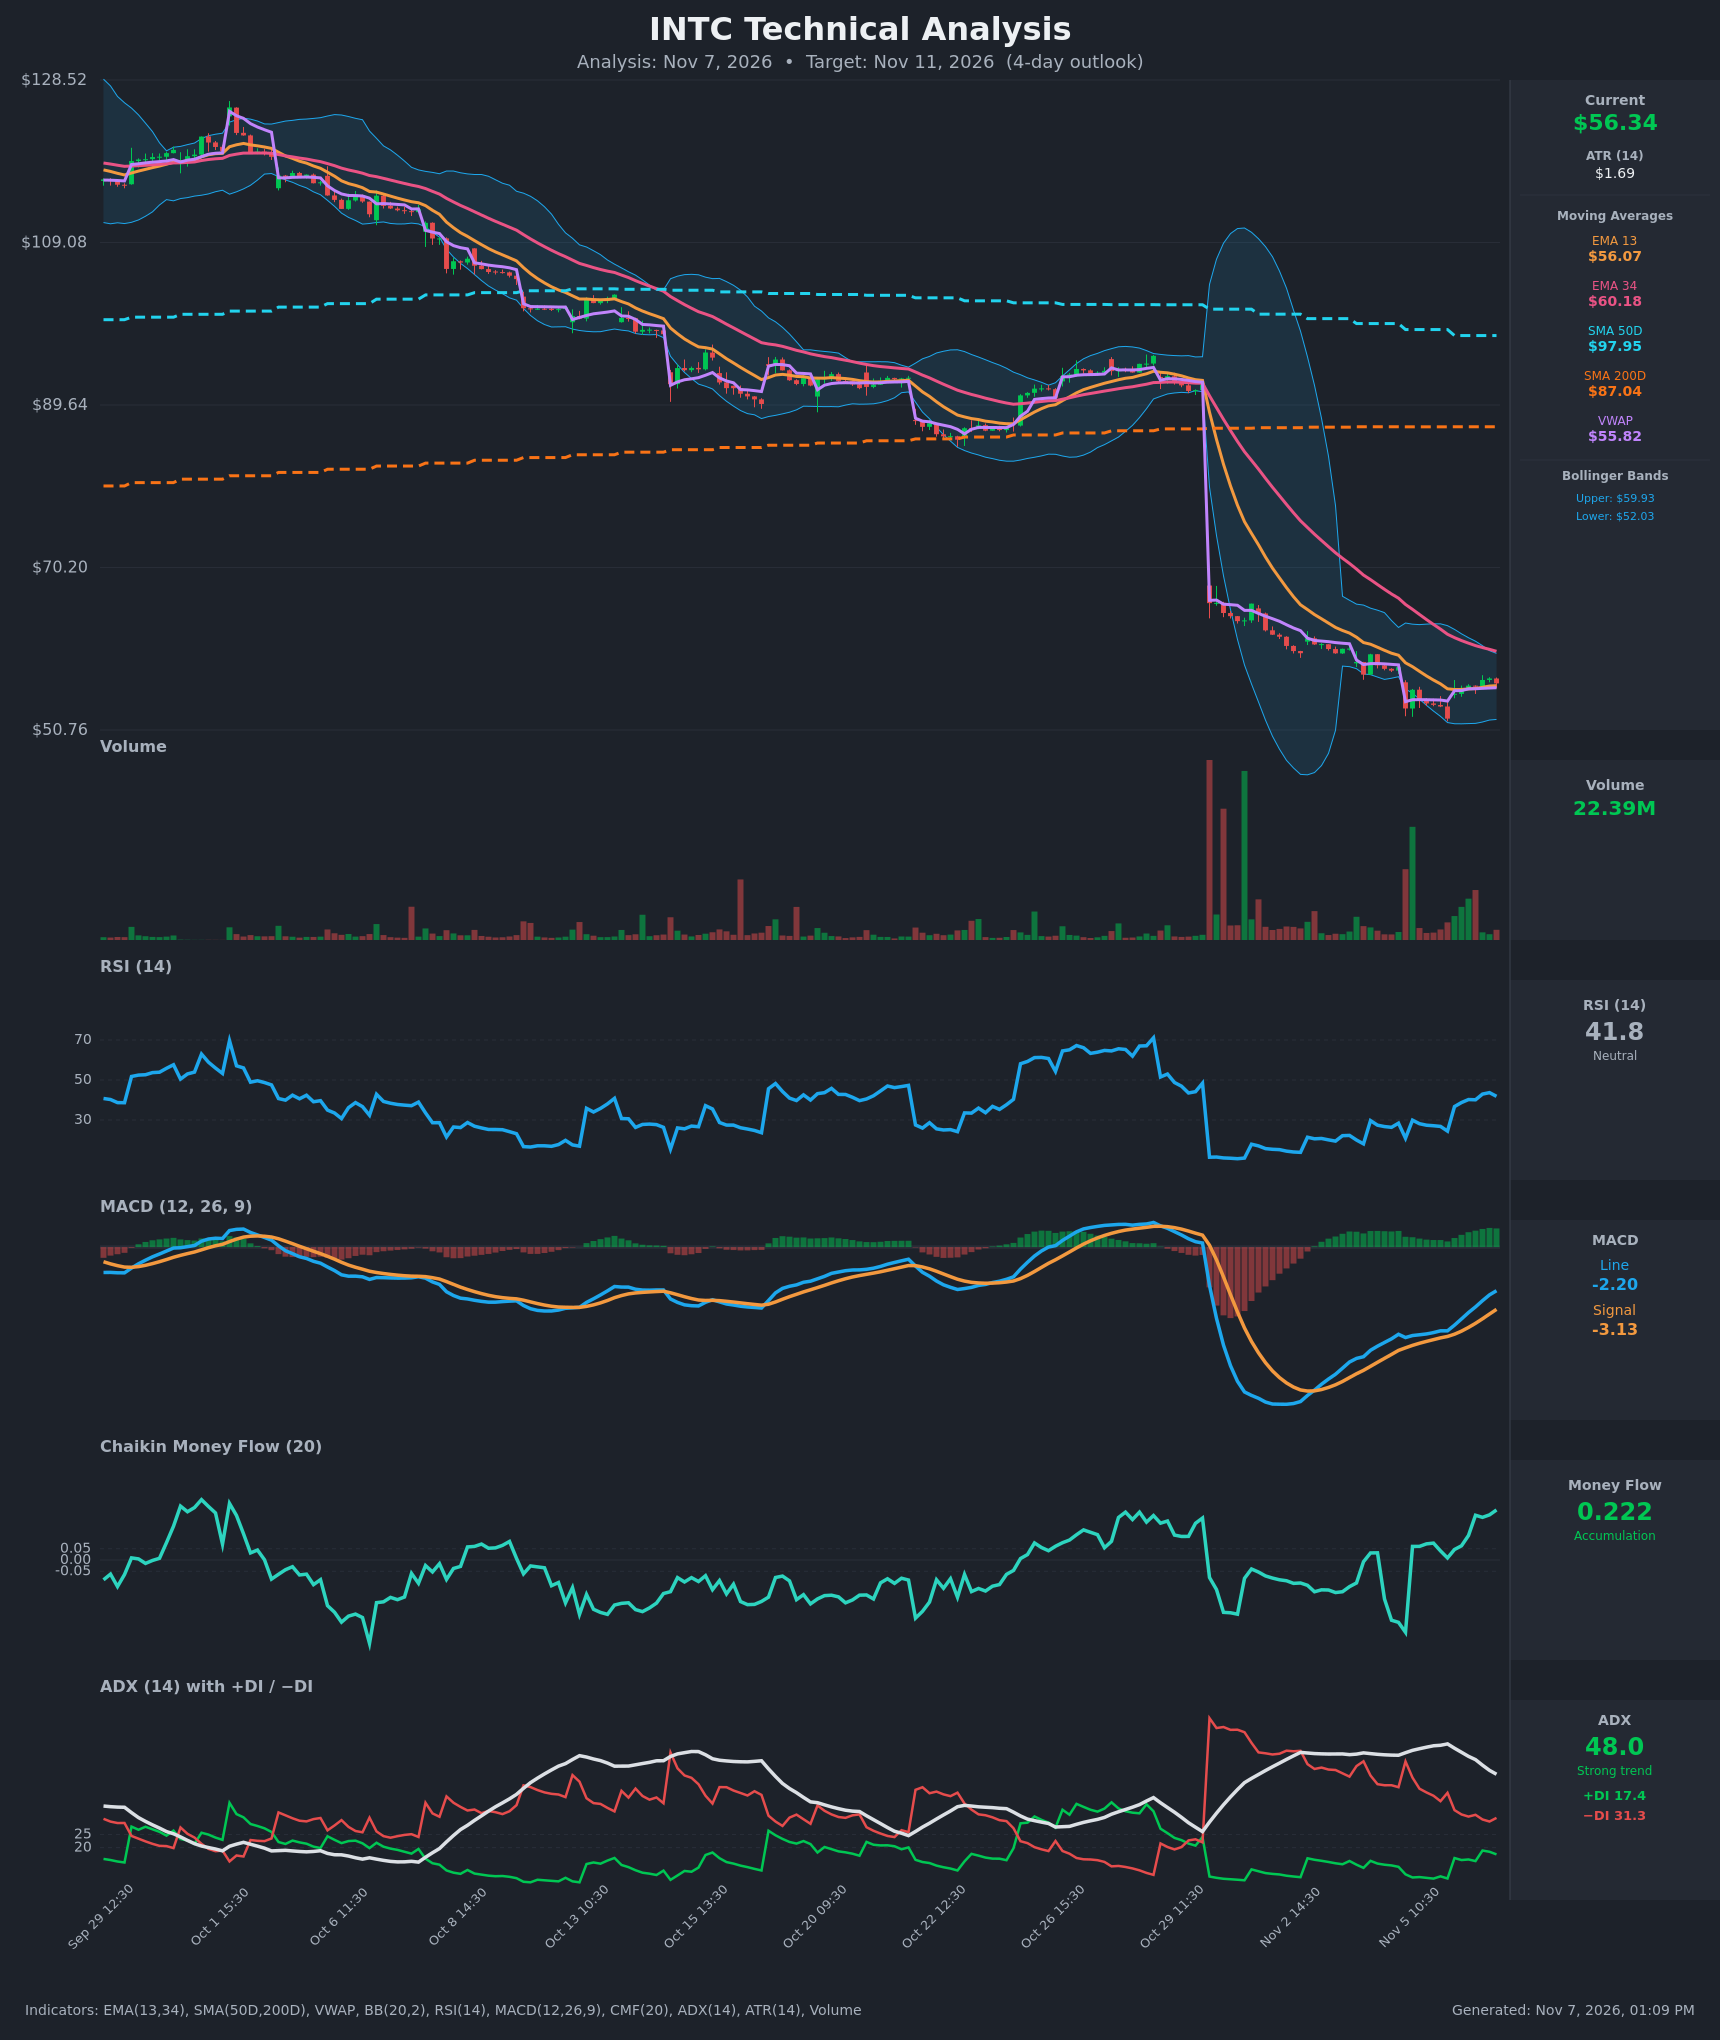
- RSI (14): 41.83, recovering from a deeply oversold 20.9 on Nov 5. It has been making higher lows (24.4, 36.7, 43.7) and is now easing slightly from 43.7. It is below 50, so the bounce has not yet shifted the regime. [Neutral]
- 20 EMA (EMA 13 used, $56.07): Price at $56.34 is just above the EMA13, which is flattening and turning up. EMA13 is still well below EMA34 ($60.18), so the bearish EMA stack stays intact. EMA34 is the overhead resistance. [Neutral]
- MACD: Line -2.20 is above signal -3.13, and the line has been rising for several bars from -4.55. This is a bullish crossover with a positive, expanding histogram, but both lines are still deep below zero, so it is a bounce within a downtrend. [Bullish]
- Bollinger Bands (20): Upper $59.93, lower $52.03, with price at $56.34, around the middle of the bands. The bands are narrowing after the crash expansion. Price bounced off the lower band (~$52.13) and is moving toward the mid-band, with the upper band near EMA34 at about $60. [Neutral]
- CMF (20): +0.222, well above +0.05 and rising. Buying pressure has built while price made lower lows, a bullish divergence. [Accumulation]
- ADX (14): 48.0, a very strong trend, but it is now falling from a 59.6 peak. −DI (31.3) is above +DI (17.4), so bears still control. The gap is narrowing: −DI is down from 52.9 and +DI is up from 8. The downtrend is losing steam but has not reversed. [Strong Trend – Bearish, fading]
- Volume: 22.39M, and volume has been elevated on the recent green bars (buying volume rising off the lows). It is still far below the capitulation spikes of the late-October gap. [Mildly bullish – accumulation on the bounce]
DIVERGENCES & TRENDS
- Bullish divergence: Price made a lower low (~$52.13) while RSI held higher (24.4 vs. 20.9 earlier), MACD turned up, and CMF climbed to +0.22.
- Momentum: MACD crossed above signal around Nov 6. The histogram is expanding positively. ADX is rolling over from its peak and −DI is declining.
- Moving averages: Price is far below SMA200D ($87.04) and SMA50D ($97.95), and EMA13 is below EMA34. The long-term trend is firmly bearish, and the SMA50D has already crossed below the SMA200D (death cross).
- VWAP: Price is above VWAP ($55.82), which is a short-term bullish positioning signal.
- Resistance: EMA34 ($60.18) and the upper Bollinger Band ($59.93) form a confluence zone that will cap any bounce.
CHART PATTERNS
- After the Oct 29 gap-down, price is basing in a tight range of about $52–$57. It resembles a Bullish Falling Wedge / Double Bottom forming on the lows (~$52.1–$53.3 retested on Nov 5), supported by the indicator divergences.
- The pattern is not confirmed. A move above ~$57 (the Nov 6 high of $56.92) would give a measured bounce toward EMA34/upper band at about $60.
- The larger structure is a bearish continuation / flag-type bounce inside a steep downtrend. The risk is that the bounce stalls under EMA34 and rolls over to retest $52.
POTENTIAL SCENARIOS
- Scenario 1: Bullish Relief Bounce Continues — Accumulation (CMF), the MACD bullish crossover, and a fading ADX/−DI let price grind higher toward the EMA34/upper-band zone. Trigger: close above $56.95 (Nov 6 high) with rising volume. Target: $58.50–$59.90. Invalidation: close below $55.10 / VWAP loss ($55.82). (50% probability)
- Scenario 2: Bearish Rejection and Retest of Lows — The bounce fades into overhead resistance while −DI still dominates, and the strong downtrend resumes. Trigger: failure at $57–$58 and break below VWAP $55.82 and $55.10. Target: $53.30, then $52.10. Invalidation: close above $60.20 (EMA34). (33% probability)
- Scenario 3: Neutral Consolidation — Price chops between $55 and $58 as the trend exhausts. Trigger: low-volume, overlapping candles. Target: $55.50–$57.50. Invalidation: a decisive break of either boundary. (17% probability)
PRICE TARGETS
- Target Price: $57.40 (4-day horizon)
- Expected Range: $55.00 to $58.50 (width $3.50 ≈ 6.2% of current price, in line with the 4-day timeframe)
- Key Levels: Support at $55.10, Resistance at $59.90
OVERALL BIAS
OVERALL BIAS: BULLISH - The MACD bullish crossover, CMF accumulation (+0.22), RSI higher lows off oversold, and price above EMA13 and VWAP favor a modest relief bounce over 4 days. Gains are likely capped near the $60 EMA34/upper-band resistance, given the strong, still-dominant long-term downtrend.
This is educational analysis and not financial advice.