INTC 7-day bullish forecast — Nov 7, 2026
- Bias: Bullish
- Timeframe: 7 days (made Nov 7, 2026, target date Nov 13, 2026)
- Price at analysis: $56.34
- Price target: $57.70
- Expected range: $54.20 – $58.80
- Result: Correct (+4.1%) — closed at $58.65 on Nov 13, 2026; quality score 100/100
Get a free AI analysis of INTC today
Analysis
TECHNICAL INDICATORS
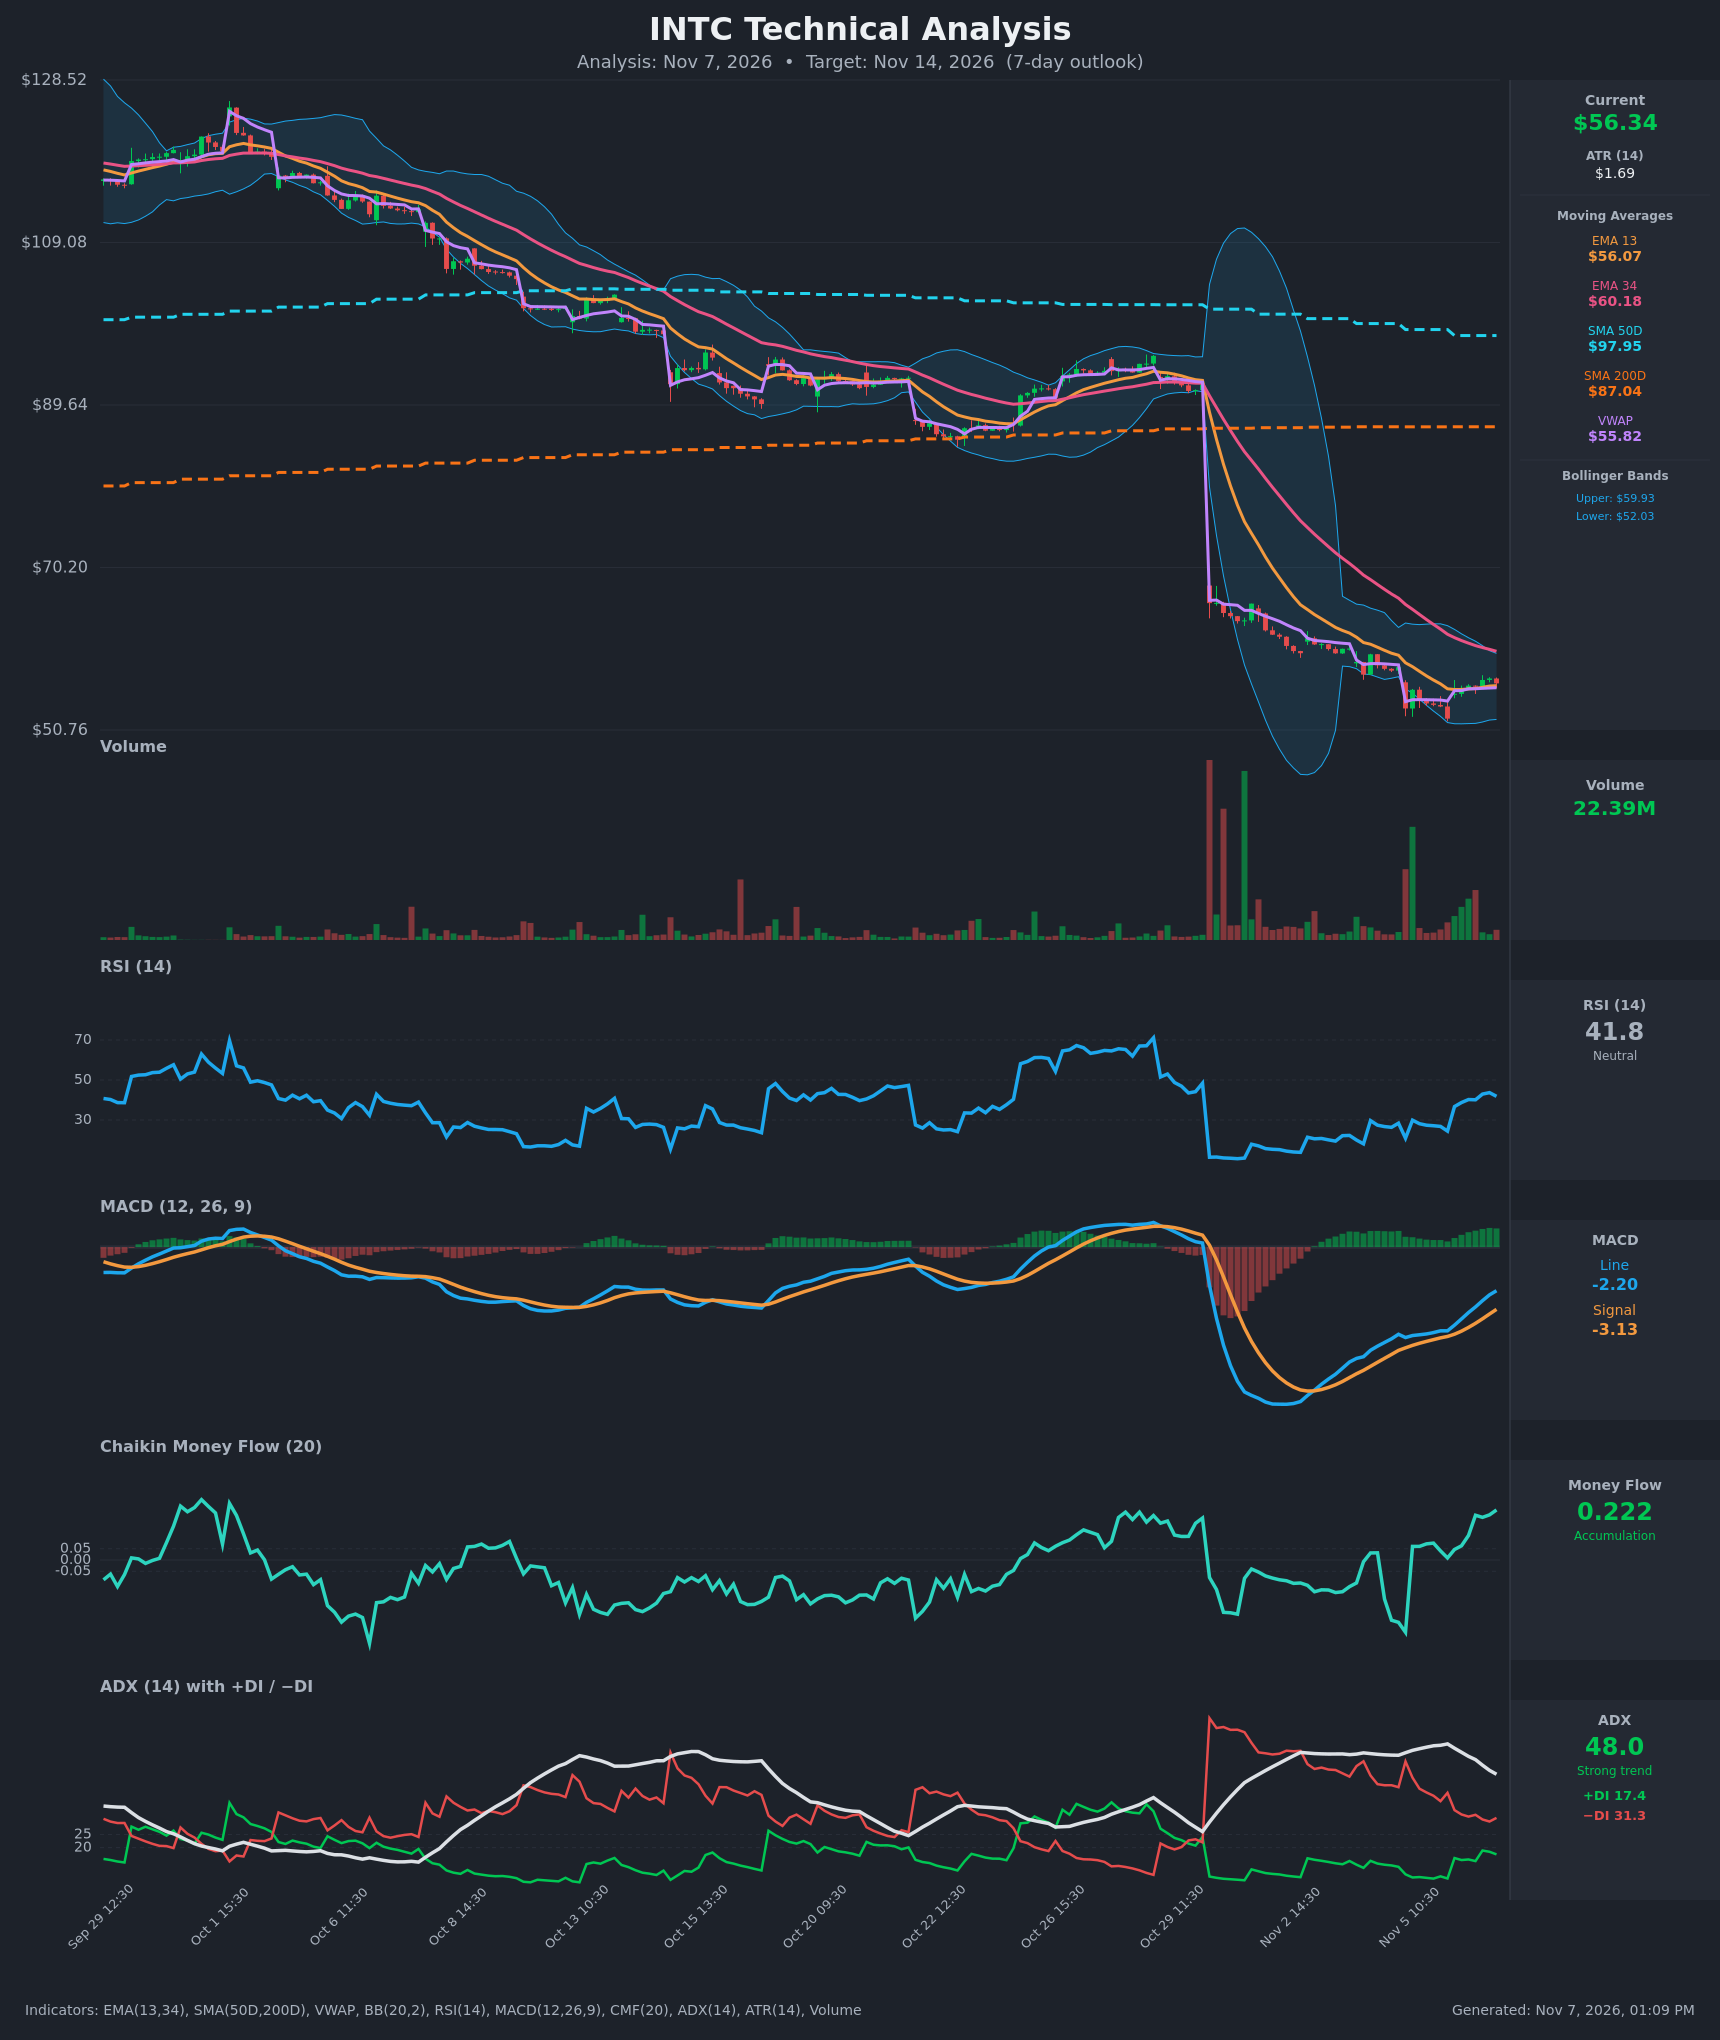
- RSI (14): 41.83, up from an oversold 20.9 on Nov 5 and rising steadily over the last 8 bars. Momentum is recovering but is still below 50, so it hasn't confirmed a trend change. [Bullish]
- 20 EMA: The data gives EMA 13 at $56.07 and EMA 34 at $60.18. Price ($56.34) is just above the EMA 13, which is acting as short-term support. It is still below the falling EMA 34, which is overhead resistance. The EMA 13 is well below the EMA 34, so there is no bullish crossover. [Neutral]
- MACD: Line -2.20 is above Signal -3.13, so the histogram is positive (about +0.94) and has been widening since the Nov 6 open. The bullish crossover happened on Nov 5/6, but both lines are still below zero, so this is a relief rally inside a larger downtrend. [Bullish]
- Bollinger Bands (20): Upper $59.93, lower $52.03, midline about $55.98. Price is just above the midline after bouncing off the lower band. The bands are still wide from the gap-down, but the range is starting to contract. There is room toward the upper band at about $59.9. [Bullish]
- CMF (20): 0.222, well above +0.05 and at a local high. It has turned from negative on Nov 4–5 to sustained positive, which suggests buyers are absorbing supply near the lows. [Accumulation]
- ADX (14): 48.0 with −DI (31.3) above +DI (17.4). This is a very strong trend, but it is bearish and ADX is rolling over from 59.6. The −DI is falling and +DI is rising, so selling pressure is fading even though bears still control the trend. [Strong Trend – Bearish, weakening]
- Volume: 22.39M, elevated against the pre-gap baseline, though far below the capitulation spikes at the gap. Green bars have dominated the last few sessions, so volume is leaning toward buying on the bounce. [Mildly Bullish]
DIVERGENCES & TRENDS
- Price made a lower low on Nov 5 (about $52.13) while RSI and MACD made higher lows. This is an early bullish momentum divergence.
- MACD has crossed above its signal line, and the histogram has moved from deeply negative to positive.
- CMF has moved from -0.32 to +0.22 while price stays depressed. This is accumulation against price.
- Price has reclaimed VWAP ($55.82) and the EMA 13, a short-term positive.
- The structure is still bearish. Price is far below SMA200 ($87.04) and SMA50 ($97.95), and EMA 13 is below EMA 34. SMA50 is falling toward SMA200, so a death cross is a longer-term risk. −DI is still above +DI.
- The trend is intact until price clears the EMA 34 near $60.2.
CHART PATTERNS
- Possible Bullish Double Bottom / base: Lows near $52–53 on Nov 4–5 with a recovery since. A neckline near $58–59 would need to break to confirm. The measured move is roughly +$6, but this is not confirmed within 7 days.
- Bearish Flag / Descending channel risk: Following the huge gap-down, the bounce is a modest, low-slope retracement. A rejection at the EMA 34 or the upper Bollinger Band would resume the downtrend, with the Nov 5 low at $52.13 as the first target.
- Context: The overall structure is a post-gap-down continuation setup. The bounce is more likely a relief rally than a reversal unless $60+ is reclaimed.
POTENTIAL SCENARIOS
- Scenario 1: Bullish Relief Bounce — Accumulation (CMF), the MACD cross and the RSI recovery push price toward the upper Bollinger Band and the EMA 34. Trigger: hold above $55.80 (VWAP/EMA 13) and break above $56.92. Target: $58.50–$59.90. Invalidation: close below $55.00. (50% probability)
- Scenario 2: Bearish Rejection / Downtrend Resumption — The bounce stalls below the falling EMA 34 and the strong downtrend (ADX 48, −DI dominant) reasserts. Trigger: failure at $58–$60 and a loss of VWAP/EMA 13. Target: $52.10–$53.50. Invalidation: close above $60.20. (35% probability)
- Scenario 3: Neutral Consolidation — Price chops between VWAP and the upper band as volatility compresses. Trigger: low-volume drift between $54.50 and $58.00. Target: $55.50–$57.00. Invalidation: close outside $52.00–$60.00. (15% probability)
PRICE TARGETS
- Target Price: $57.70 (7-day, about +2.4%)
- Expected Range: $54.20 to $58.80 (width $4.60, about 8.2% of current price, consistent with the 7-day guidance and about 1.8x ATR on each side)
- Key Levels: Support at $55.82 (VWAP; $52.13 is the major swing low), Resistance at $59.93 (upper Bollinger Band; EMA 34 just above at $60.18)
OVERALL BIAS
OVERALL BIAS: BULLISH - Short-term momentum is turning up: a MACD bullish cross, RSI recovering from oversold, strong CMF accumulation, and price above VWAP and the EMA 13 with a bullish RSI/MACD divergence at the lows. The favored outcome is a relief bounce toward $58–$60, capped by the falling EMA 34. The broader downtrend (ADX 48, −DI dominant, price far below SMA200) keeps conviction modest.
This is educational analysis and not financial advice.