USO 4-day bullish forecast — Nov 7, 2026
- Bias: Bullish
- Timeframe: 4 days (made Nov 7, 2026, target date Nov 10, 2026)
- Price at analysis: $148.41
- Price target: $150.00
- Expected range: $146.00 – $152.60
- Result: Incorrect (-4.7%) — closed at $141.45 on Nov 10, 2026; quality score 2/100
Get a free AI analysis of USO today
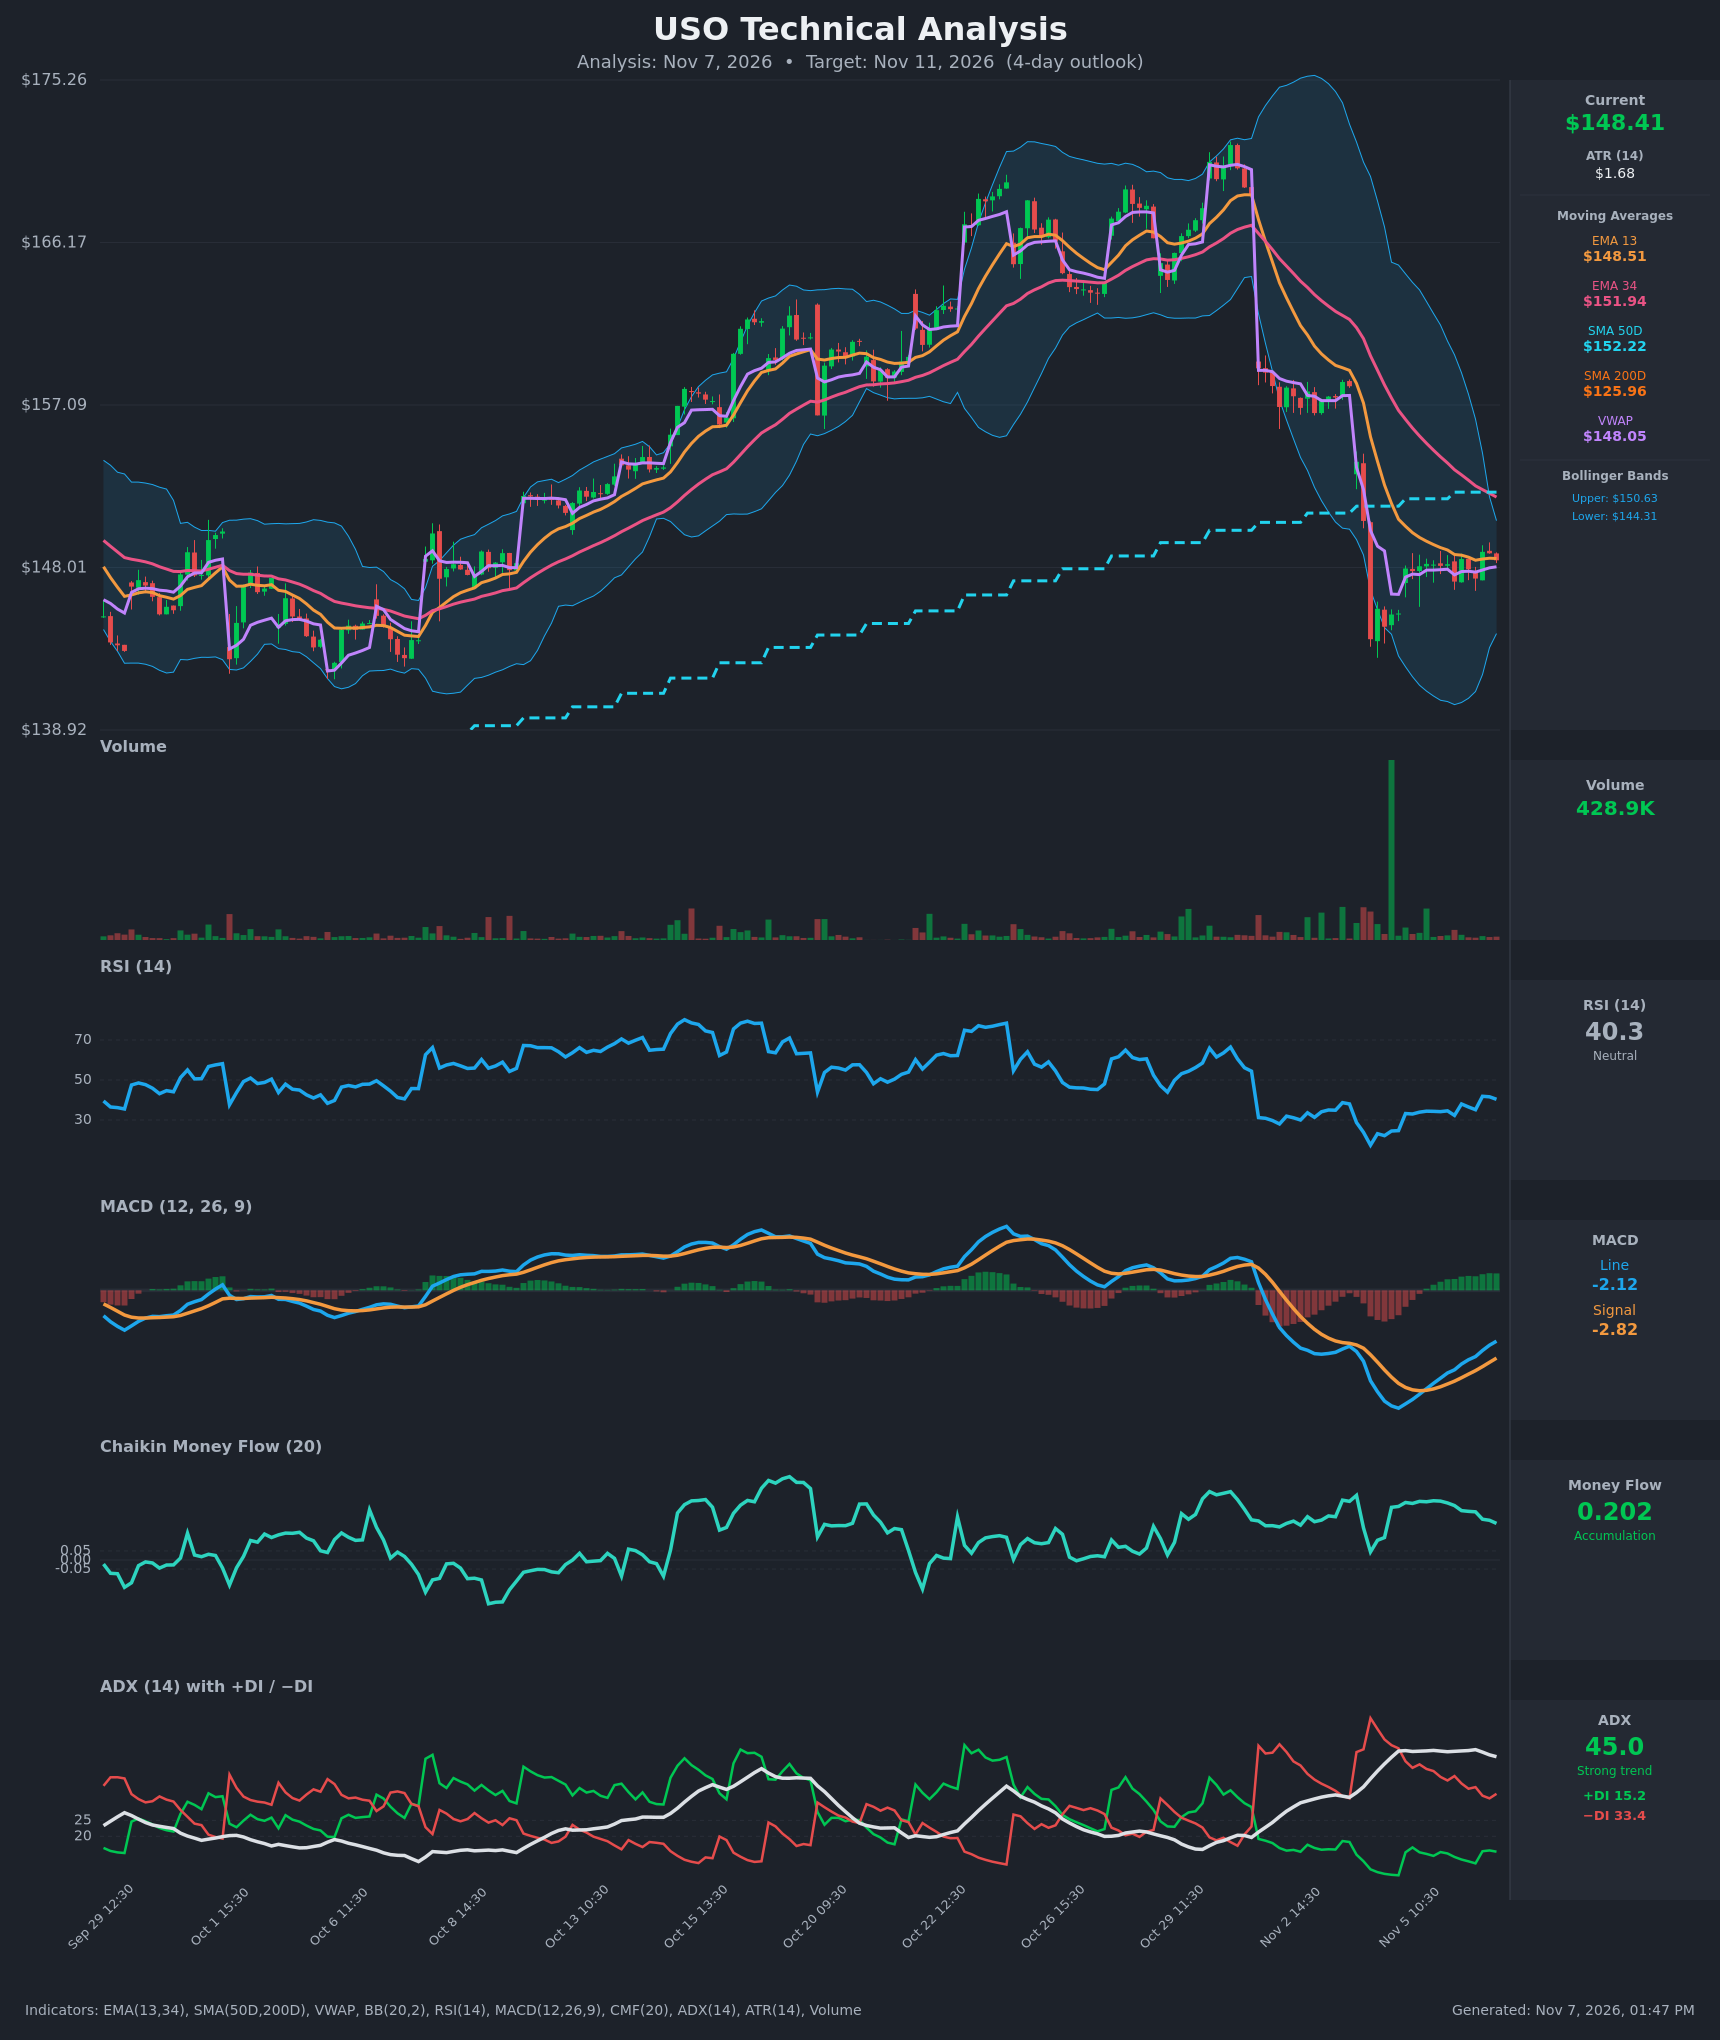
Analysis
TECHNICAL INDICATORS
- RSI (14): 40.34, up from a low of 24.7 on Nov 4. It has made higher lows through the consolidation but is still below 50 and has not yet reached the bearish-to-neutral boundary zone. Momentum is recovering from oversold. [Neutral]
- 20 EMA: Not shown directly, so I use the EMA 13 ($148.51) and EMA 34 ($151.94). Price ($148.41) sits right on the flat EMA 13, which acts as a pivot. The EMA 34 ($151.94) and SMA 50D ($152.22) are overhead resistance, and the EMA 13 remains below the EMA 34 (bearish structure). [Neutral]
- MACD: The line (-2.12) crossed above the signal (-2.82) around Nov 5 12:30. The histogram is positive and rising, but both lines are well below zero, so this is a recovery bounce inside a larger downtrend. [Bullish]
- Bollinger Bands (20): Upper $150.63, lower $144.31, midline about $147.47. Price is in the upper half of the bands, and the bands are narrowing after the earlier expansion. A squeeze is forming, and the upper band is the first test. [Neutral]
- CMF (20): 0.202, well above +0.05, and positive throughout the whole consolidation. The large green volume spike at the $142 low and steady buying since point to accumulation. [Accumulation]
- ADX (14): 45.0 with −DI (33.4) above +DI (15.2). This is a strong downtrend, but ADX is flattening and slipping from 47.2. The gap between −DI and +DI is narrowing (it was 40 on Nov 4, now 18), so bearish control is fading. [Strong Trend, Bearish, but weakening]
- Volume: 428.9K, light compared with the capitulation spike near the low. Volume is drying up during the sideways drift. That is typical of consolidation and shows no urgent selling. [Neutral / Selling exhaustion]
DIVERGENCES & TRENDS
- Possible bullish divergence: Price printed a lower low (~$142) with RSI at the 24-25 extreme. Since then price has held a tight $147-$149 range while RSI and MACD climb, so momentum is improving faster than price.
- MACD bullish crossover occurred below zero. These are lower-quality signals unless price clears resistance.
- DI convergence: −DI is falling from 47.6 to 33.4 while +DI recovers from 7.8 to 15.2. A +DI/−DI cross has not happened and is still far off.
- MA structure: Price is far above the SMA 200D ($125.96), so the long-term trend is up. The SMA 50D ($152.22) is above the SMA 200D, with no death cross. The EMA 13 is below the EMA 34, so the short-term trend is down, but the gap is closing (from about $6 to about $3.4).
- VWAP: Price ($148.41) is just above VWAP ($148.05), a mild sign of buyers defending the level.
CHART PATTERNS
- The sharp drop from ~$170 to ~$142 followed by a tight, shallow sideways consolidation resembles a Bearish Pennant / Flag Pattern (continuation). The pole is the large decline, with a measured-move target of roughly $10-12 lower if support breaks.
- The accumulation signature (CMF at 0.20, volume spike at the low, rising RSI and MACD, higher lows) argues instead for a base in the lower portion of the Bullish Falling Wedge / Double Bottom family. A close above ~$150.60 would confirm it, with a target near the EMA 34/SMA 50D zone at $152.
- The consolidation is only about 6 sessions old, so neither pattern is confirmed. Because indicators lean toward improving momentum, I give the upside resolution a modest edge. The $147 support is the key line.
POTENTIAL SCENARIOS
- Scenario 1: Bullish Relief Bounce to the Moving Averages — Accumulation (CMF 0.20) and the MACD crossover support a push through the upper Bollinger Band toward the declining EMA 34/SMA 50D cluster. Trigger: hourly close above $150.63 with rising volume. Target: $151.90-$152.20. Invalidation: close below $147.00. (45% probability)
- Scenario 2: Bearish Pennant Breakdown — ADX at 45 with −DI dominant means the downtrend can resume. A break of the consolidation low would put the $142-$144 area back in play. Trigger: close below $147.00 with expanding volume. Target: $144.30 (lower Bollinger Band), then $142. Invalidation: reclaim of $149.50. (35% probability)
- Scenario 3: Neutral Continued Chop — Narrowing bands and fading ADX keep price pinned between VWAP and the upper band. Trigger: no close beyond $147.00-$150.60. Target: $147.50-$149.50. Invalidation: close outside $147.00-$150.60. (20% probability)
PRICE TARGETS
For the 4-day timeframe (to Nov 11), the range width is about 4.4% of price ($6.60 on $148.41), scaled between 2-3 day and 7-10 day guidance and roughly 4x ATR.
- Target Price: $150.00
- Expected Range: $146.00 to $152.60
- Key Levels: Support at $147.00, Resistance at $150.63
OVERALL BIAS
OVERALL BIAS: BULLISH - A bullish MACD crossover, rising RSI off oversold, strong CMF accumulation, and fading −DI dominance favor a relief bounce toward the $150-$152 moving-average zone. The strong ADX downtrend and bearish-pennant risk below $147 keep conviction modest.
This is educational analysis and not financial advice.