USO 7-day bullish forecast — Nov 7, 2026
- Bias: Bullish
- Timeframe: 7 days (made Nov 7, 2026, target date Nov 13, 2026)
- Price at analysis: $148.41
- Price target: $150.40
- Expected range: $145.30 – $153.80
- Result: Incorrect (-1.9%) — closed at $145.64 on Nov 13, 2026; quality score 47/100
Get a free AI analysis of USO today
Analysis
TECHNICAL INDICATORS
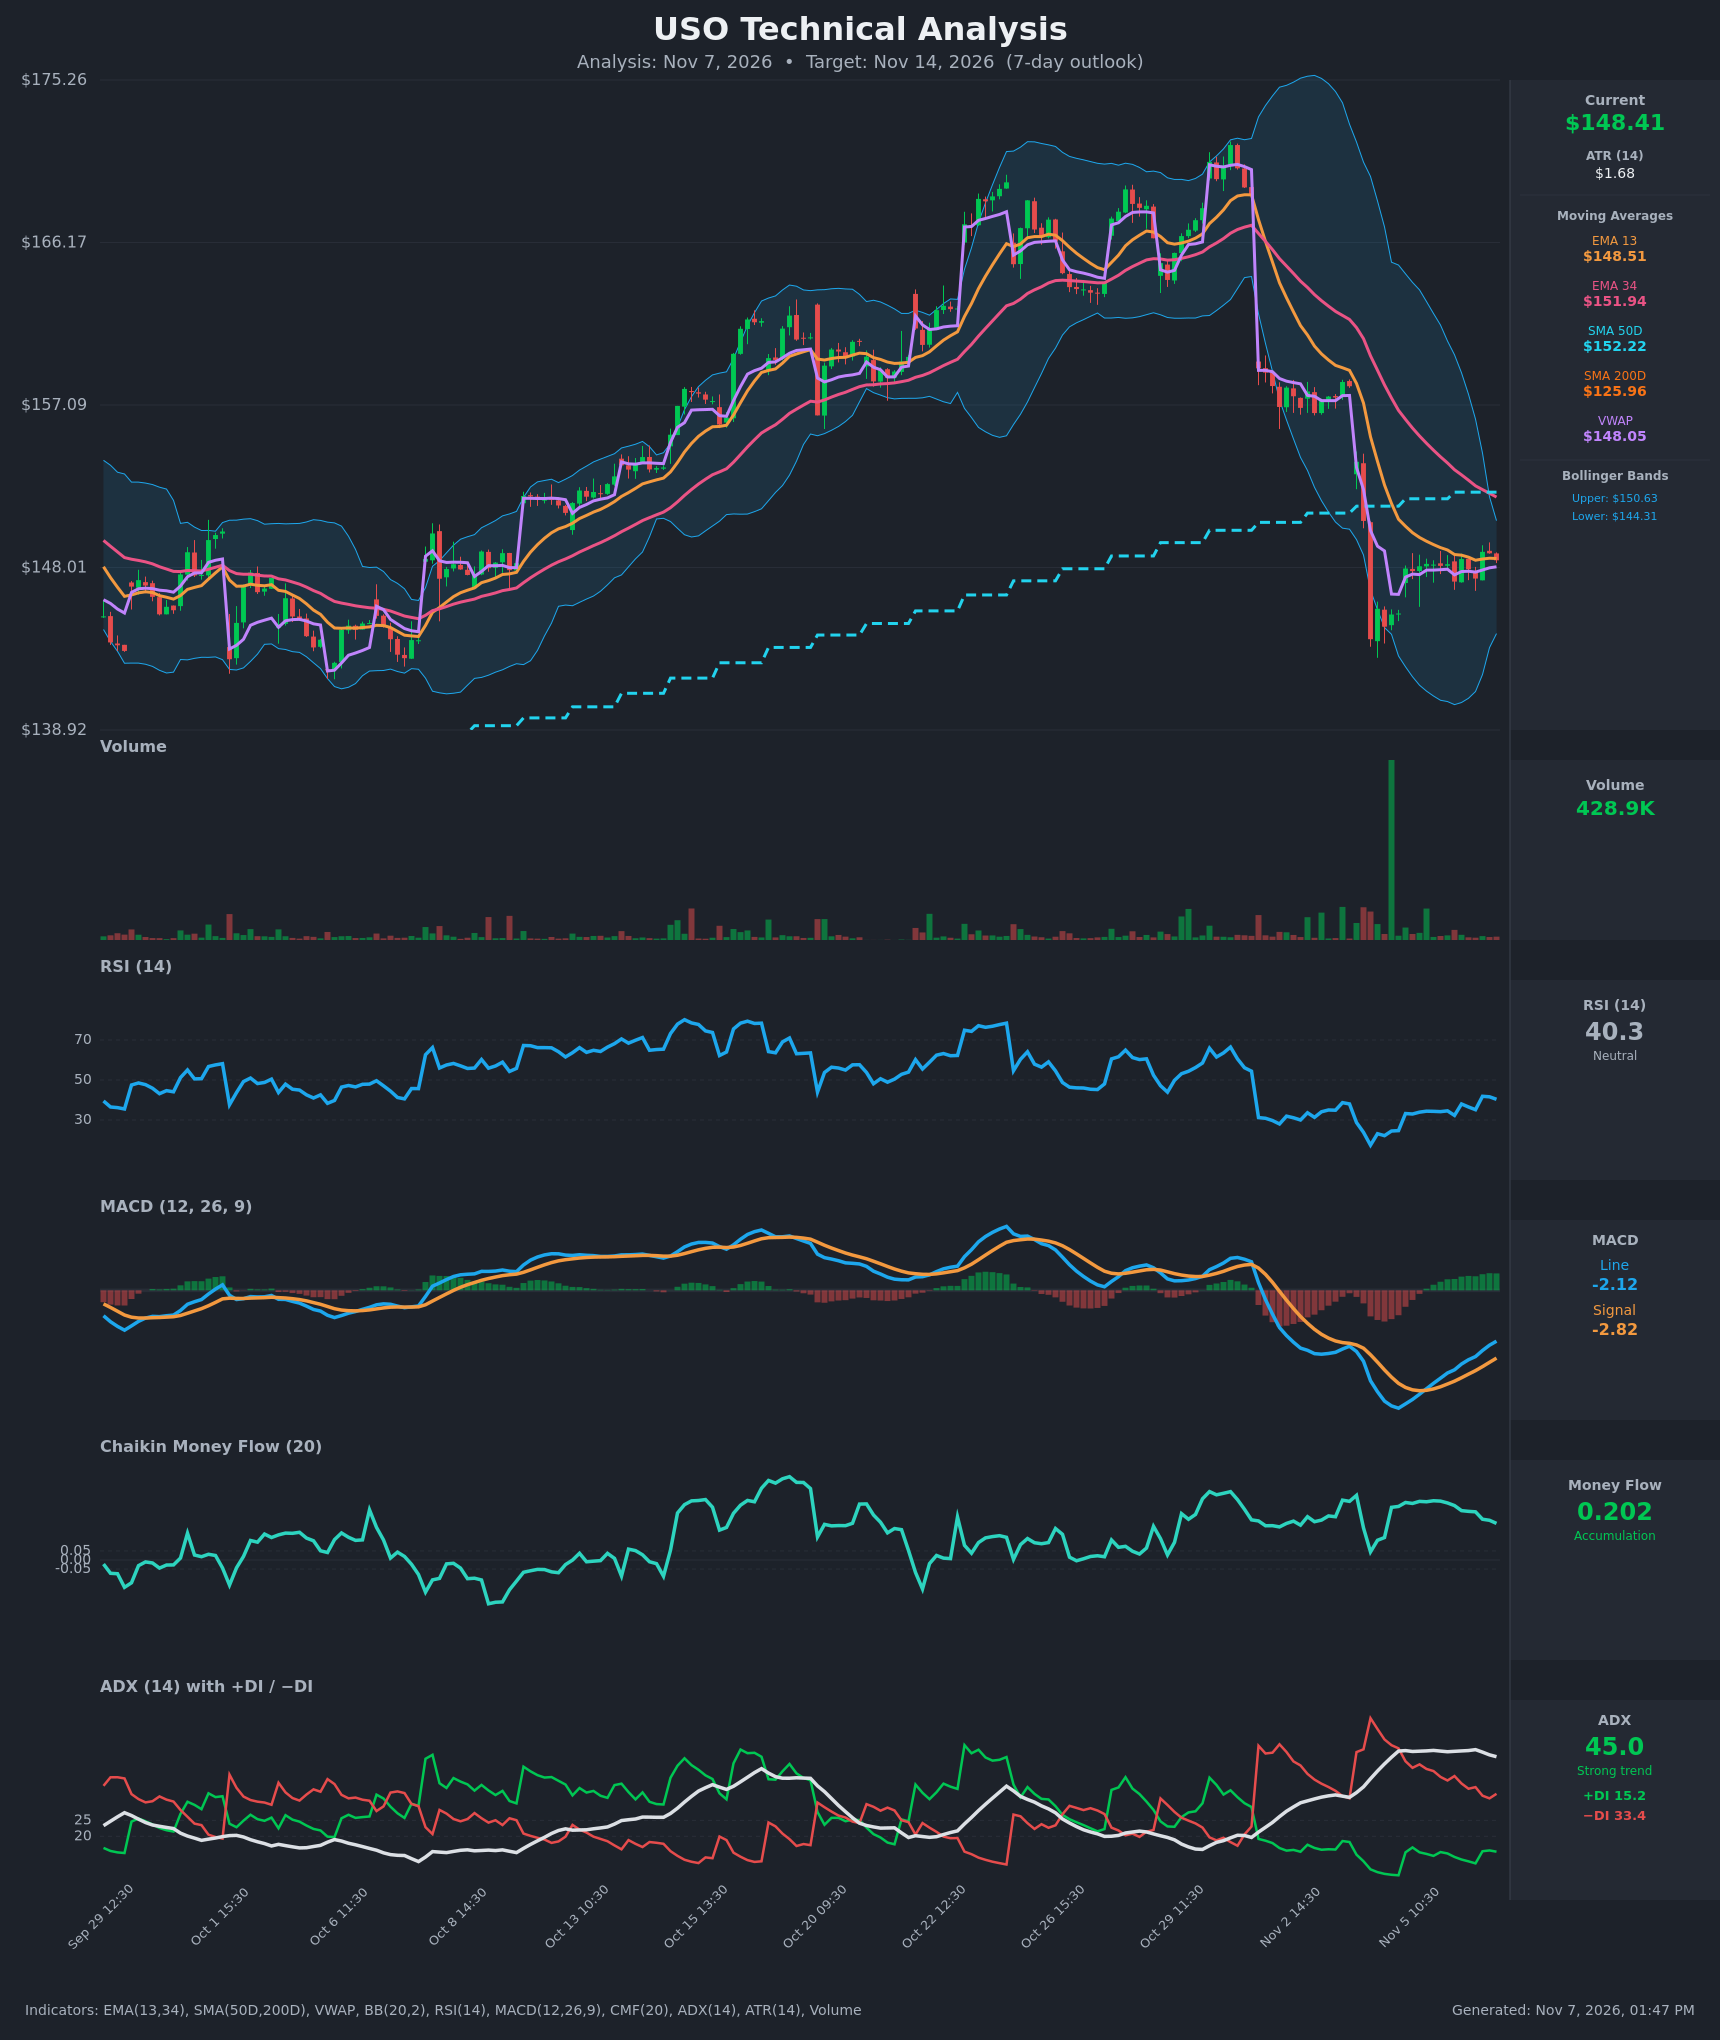
- RSI (14): 40.34, recovering from an extreme oversold 24.7 on Nov 4. It has made higher lows since the capitulation but is still below the 50 midline, so it signals a bounce rather than a trend reversal. [Neutral]
- 20 EMA (EMA 13 / EMA 34 used as proxy): Price at $148.41 sits right on the EMA13 ($148.51), which has flattened. It is well below the EMA34 ($151.94), which is still sloping down and now acts as resistance. EMA13 is below EMA34, a bearish alignment, but the gap is narrowing quickly. [Bearish]
- MACD: Line -2.12 is above the signal at -2.82, with a positive histogram of about +0.70. The bullish crossover happened around Nov 5 13:30, and both lines are rising from deeply negative territory. This is a bounce signal, not yet a trend change, because both lines are still below zero. [Bullish]
- Bollinger Bands (20): Upper $150.63, lower $144.31, midline about $147.47. Price is just above the midline after bouncing off the lower band, and the bands are still wide after the selloff. A move to the upper band near $150.6 is the natural bounce target. [Neutral]
- CMF (20): 0.202, well above +0.05, with accumulation sustained across all 15 bars. It is inflated by the high-volume capitulation bar still in the window, but there are no signs of distribution. [Accumulation]
- ADX (14): 45.0 with −DI 33.4 above +DI 15.2, so bears still control a strong downtrend. ADX has slipped from 47.2 to 45.0, and the DI spread has narrowed from about 40 points to 18, so the selling pressure is fading. [Strong Trend – Bearish, weakening]
- Volume: 428.9K, far below the huge capitulation spike on Nov 4. The two-day consolidation is on quiet volume, which suggests selling exhaustion rather than fresh distribution. [Neutral / Selling exhaustion]
- Moving averages and VWAP: SMA50 $152.22 is overhead and flattening, and SMA200 $125.96 is far below, so the long-term trend is still up. Price is just above VWAP ($148.05), a slight buyer edge. [Neutral]
DIVERGENCES & TRENDS
- RSI and MACD have made higher lows since Nov 4 while price has held a tight range, which is a mild bullish momentum recovery.
- The MACD bullish crossover came with the histogram turning positive, and the ADX/DI spread is compressing, so the downtrend is losing energy.
- The EMA13/EMA34 gap has narrowed from about $6 to $3.4. A bullish EMA crossover would need a push toward $152.
- There is no golden or death cross to worry about. SMA50 is far above SMA200, and the long-term uptrend is intact despite the sharp pullback.
- Price is still below EMA34 and SMA50, and −DI still leads, so any rally is a counter-trend bounce until $152 is reclaimed.
CHART PATTERNS
- Bearish Pennant / Flag (continuation): After the sharp drop from about $165 to $146, price has formed a tight, sideways-to-slightly-up consolidation between about $147 and $149. A break below $146.8 would target the measured move toward $142–$143.
- Bullish Falling Wedge / base (reversal), partial: Higher lows in RSI and MACD hint at a base. A break above $149 and then $150.6 (upper Bollinger Band) would target the EMA34/SMA50 zone at $152.
- The pattern is ambiguous, but the momentum and accumulation evidence favors a retest of overhead resistance first. The flag-breakdown risk remains.
POTENTIAL SCENARIOS
- Scenario 1: Bullish Relief Rally to EMA34/SMA50 — Momentum recovery (MACD above signal, CMF accumulation, fading DI spread) carries price through the consolidation high and up to the declining EMA34 and upper Bollinger Band. Trigger: close above $149.00 with rising volume. Target: $150.60–$152.00. Invalidation: close below $146.80. (50% probability)
- Scenario 2: Bearish Flag Breakdown — The strong downtrend (ADX 45, −DI dominant) resumes. The bounce fails at EMA13/VWAP and the consolidation breaks lower. Trigger: break below $146.80. Target: $144.30, then $142.50. Invalidation: close above $151.94. (35% probability)
- Scenario 3: Neutral Range Chop — Price keeps drifting between $146.80 and $150.00 while volatility compresses. Trigger: failure to break either boundary on volume. Target: $147.50–$149.50. Invalidation: a decisive close outside the $146.80–$150.60 band. (15% probability)
PRICE TARGETS
- Target Price: $150.40 (7-day horizon)
- Expected Range: $145.30 to $153.80 (width $8.50, about 5.7% of current price, consistent with the 7–10 day guidance)
- Key Levels: Support at $147.00, Resistance at $151.94
OVERALL BIAS
OVERALL BIAS: BULLISH - The MACD bullish crossover, RSI recovering from deeply oversold, sustained CMF accumulation and a narrowing DI spread favor a relief rally toward the EMA34/SMA50 zone near $151–$152. Conviction is modest because the ADX 45 downtrend and the flag-breakdown risk remain, and a close below $146.80 would invalidate the call.
This is educational analysis and not financial advice.