INTC 23-day bearish forecast — Nov 7, 2026
- Bias: Bearish
- Timeframe: 23 days (made Nov 7, 2026, target date Nov 29, 2026)
- Price at analysis: $56.28
- Price target: $53.00
- Expected range: $48.50 – $58.50
- Result: Pending — graded after the close on Nov 29, 2026
Get a free AI analysis of INTC today
Analysis
TECHNICAL INDICATORS
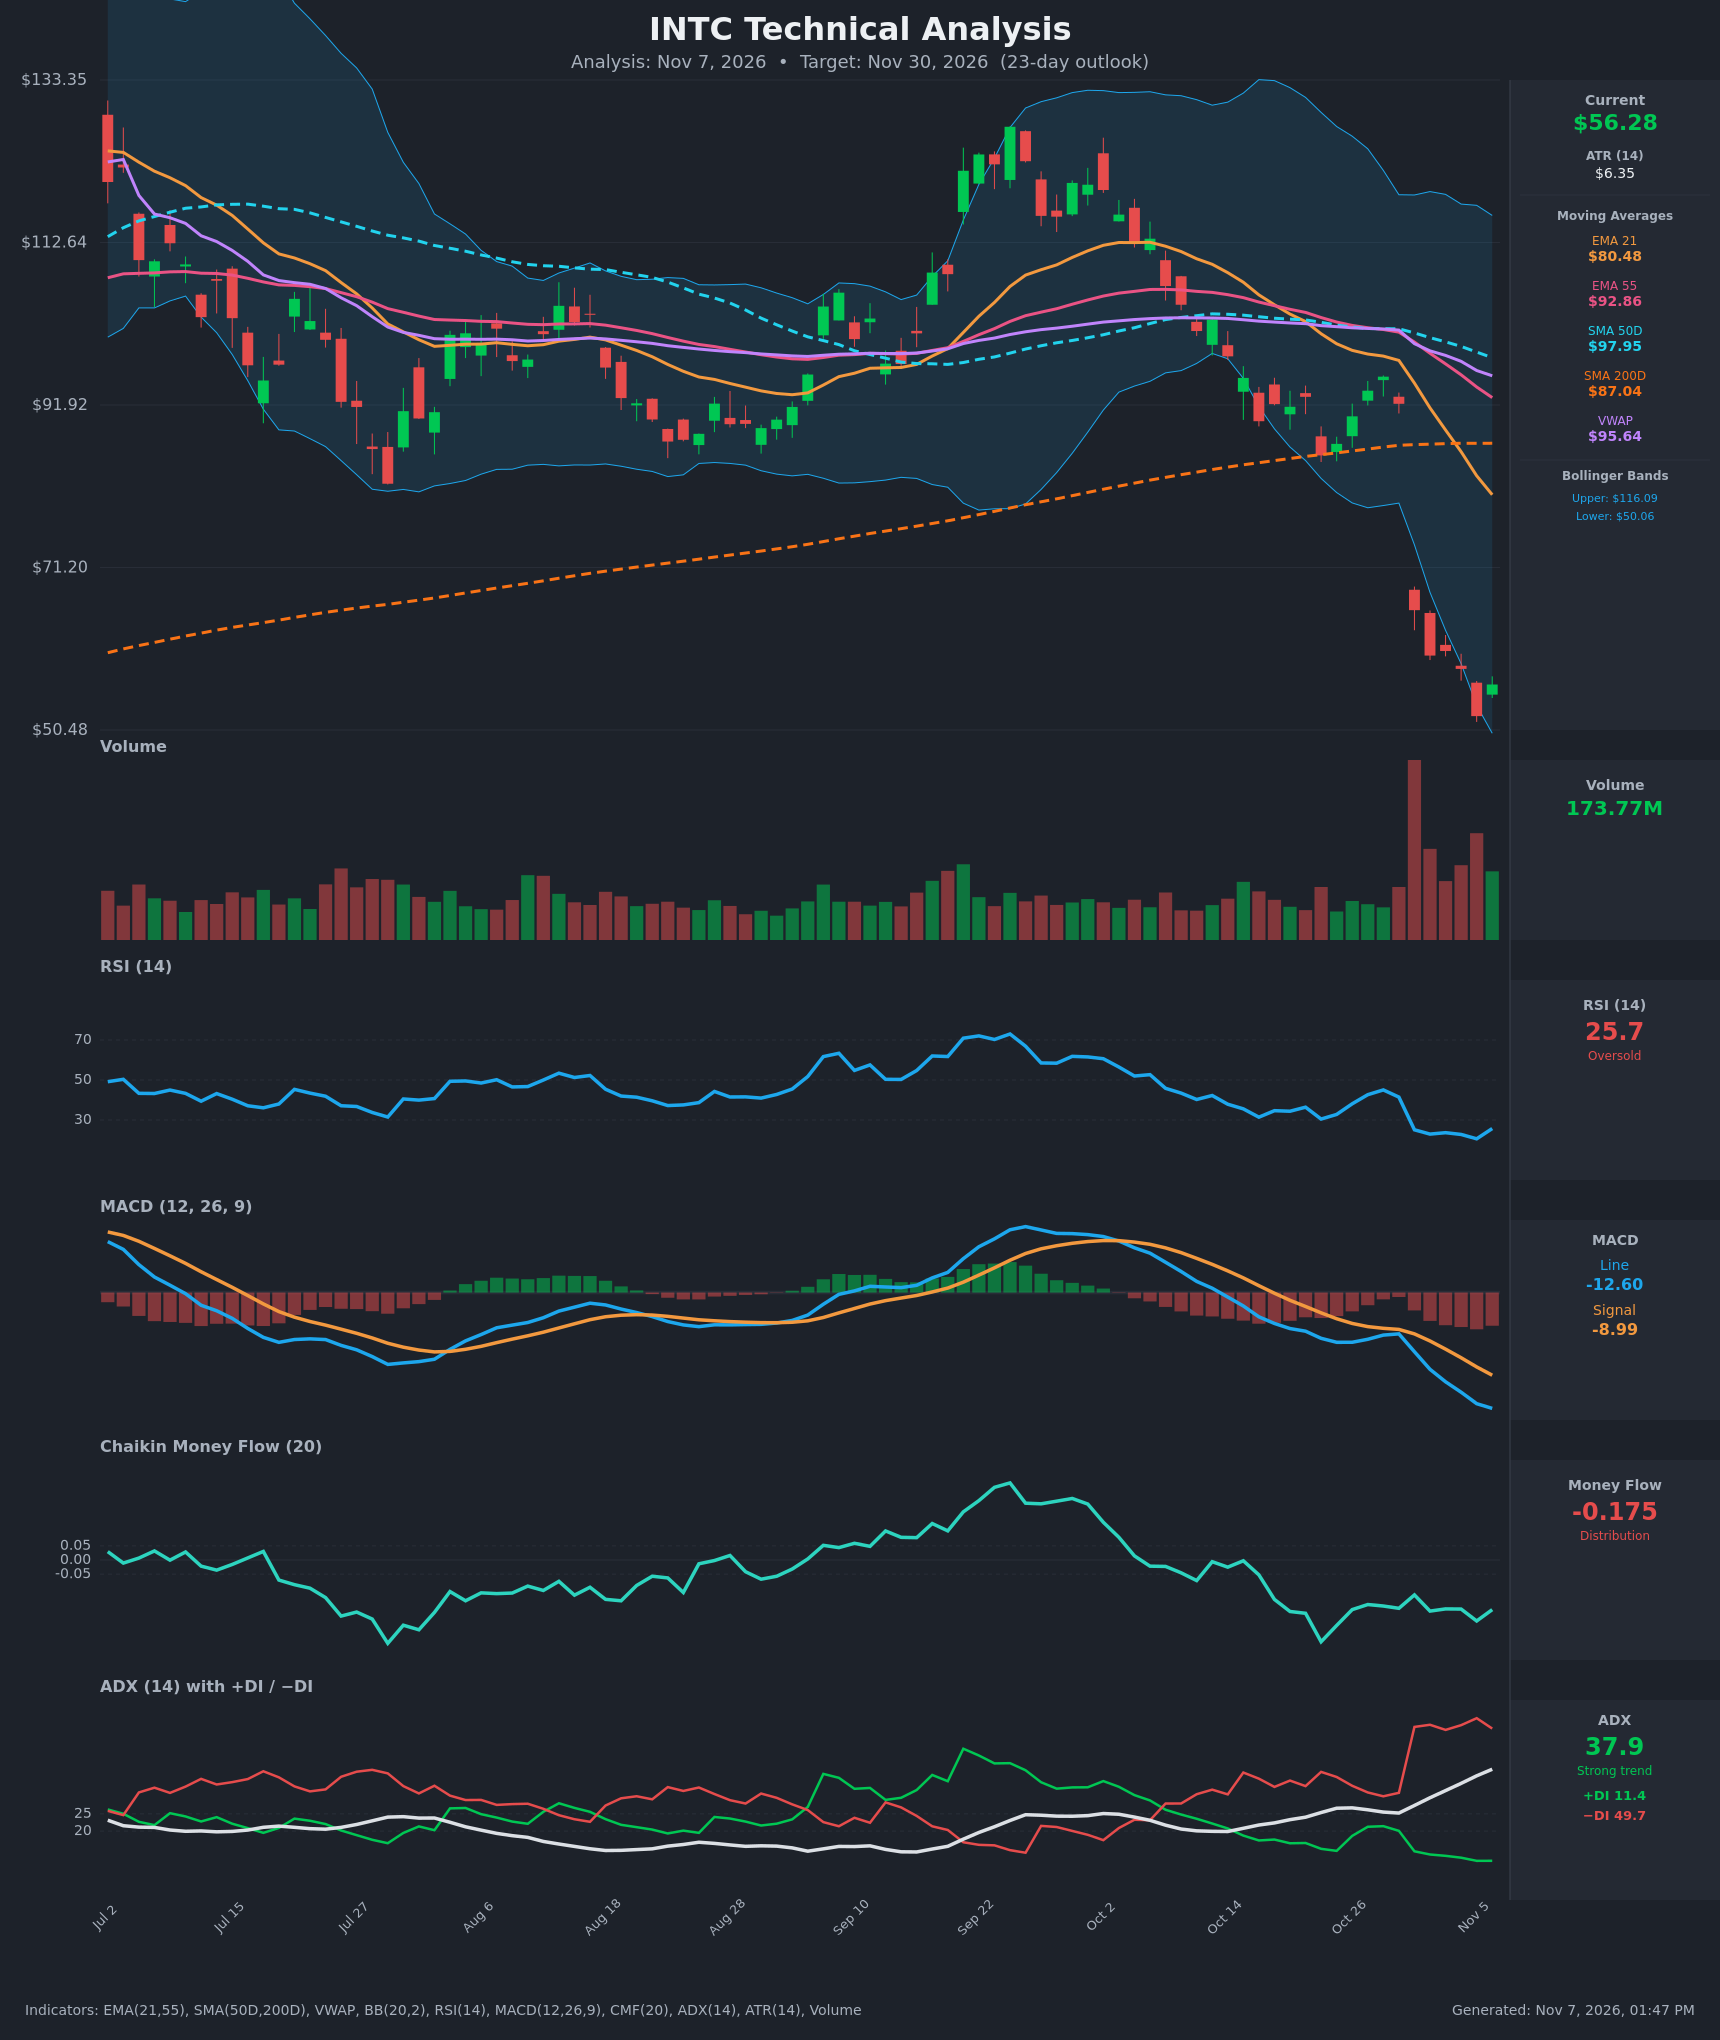
- RSI (14): 25.72, oversold. It bottomed at 20.6 on Nov 5 and ticked up to 25.7 with the small bounce. It has been below 30 for six sessions after falling from 41.5 on Oct 29. A tentative oversold uptick is not yet a reversal. [Neutral]
- 20 EMA (EMA 21): $80.48, with price about 30% below it. The EMA21 is falling steeply (from $104.69 on Oct 19) and acts as heavy overhead resistance. EMA21 crossed below EMA55 ($92.86) on Oct 20, a bearish crossover. [Bearish]
- MACD: Line -12.60 is below signal -8.99, with the histogram at about -3.6 and still widening. The line has been below the signal since Oct 19, with no sign of a turn. [Bearish]
- Bollinger Bands (20): Upper $116.09, lower $50.06, so the bands are very wide after the volatility spike. Price at $56.28 sits in the lower quarter of the bands, after the Nov 5 low of $52.25 probed the lower band. Walking or hugging the lower band in a strong downtrend is bearish, but it is also stretched. [Bearish]
- CMF (20): -0.175, well below -0.05. It has been negative since late October and shows no sign of recovering, so selling pressure persists. [Distribution]
- ADX (14): 37.9 and rising steadily (22.4 → 37.9). −DI at 49.7 is far above +DI at 11.4, which is a one-sided bearish trend. [Strong Trend – Bearish]
- Volume: 173.77M on the latest bar, well above the typical level on the chart. The Oct 30 gap down (about -29%) came on a huge volume spike, and volume has stayed elevated on every sell-off bar since. The latest green bar on high volume is the first sign of dip-buying, but it is not yet convincing. [Heavy distribution with a possible capitulation attempt]
DIVERGENCES & TRENDS
- No bullish RSI or MACD divergence yet. RSI made a lower low (20.6) with price (52.25), and MACD is still making new lows.
- RSI's tick up from 20.6 to 25.7 is a minor relief bounce only. A confirmed divergence would need a lower price low with a higher RSI low.
- MAs are in full bearish alignment: price ($56.28) < EMA21 ($80.48) < SMA200D ($87.04) < EMA55 ($92.86) < VWAP ($95.64) < SMA50D ($97.95). Price is below the SMA200D, so the long-term trend has turned down.
- The SMA50D (about $97.95) is still above the SMA200D (about $87.04) but falling. A death cross is possible within weeks if the weakness persists.
- ADX has risen for two weeks and −DI jumped from about 30 to 50 on the gap. The +DI/−DI gap remains very wide, so there is no DI crossover.
- Price is extremely extended below the EMAs, so a sharp mean-reversion bounce toward $60–65 is plausible even within a downtrend.
CHART PATTERNS
- No clean reversal pattern is complete. The $52–$60 area is forming a small base or consolidation after the gap down (Oct 30 close $65.76, then $59.97, $60.55, $58.27, $52.25, $56.28).
- The closest reference pattern is the Bearish Flag/Pennant (continuation): a sharp vertical drop (the "pole") followed by a tight consolidation. A break below $52.25 would project a measured move of roughly $10–$15 lower, toward $40–$45, though not fully within 23 days.
- The alternative reading is a Bullish Double Bottom forming near $52 if price retests the low and holds. That is speculative, with no neckline or confirmation yet.
- The gap from $92 to $66 is unfilled, and gaps this large rarely close quickly.
POTENTIAL SCENARIOS
- Scenario 1: Bearish Trend Continuation / Bearish Flag Resolution — The downtrend (ADX 38, −DI 50, CMF -0.175, widening MACD) keeps pushing price lower after a brief relief bounce fails below the EMA21 and prior gap-area resistance. Trigger: a close below $52.25 (the Nov 5 low). Target: $48–$50 (lower BB near $50), with an extension toward $46. Invalidation: a daily close above $62 on strong volume. (47% probability)
- Scenario 2: Bullish Oversold Relief Rally — RSI at 25 and price at the lower Bollinger Band trigger mean-reversion buying, and the bounce extends into the broken $60–$66 gap zone. Trigger: a close above $60.50 with MACD histogram starting to shrink. Target: $62–$66. Invalidation: a close below $52 would cancel the bounce. (38% probability)
- Scenario 3: Neutral Base Building — Price chops between about $52 and $60 as selling exhausts and buyers accumulate. Trigger: repeated holds of $52–$53 with lower volume. Target: $54–$58. Invalidation: a close outside $51–$61. (15% probability)
PRICE TARGETS
- Target Price: $53.00 (23-day outlook, about -5.8% from $56.28)
- Expected Range: $48.50 to $58.50 (width $10.00, about 17.8% of current price, in line with the 30–60 day tier given the high ATR of $6.35)
- Key Levels: Support at $52.25 (Nov 5 low, just above the lower BB at $50.06), Resistance at $60.50 (Nov 3 close area and the top of the post-gap consolidation)
OVERALL BIAS
OVERALL BIAS: BEARISH - The trend is strongly down: ADX is 37.9 with −DI far above +DI, price sits below every moving average including the SMA200D, MACD is widening below its signal, and CMF shows persistent distribution. The oversold RSI (25.7) raises the odds of a relief bounce, but nothing yet confirms a reversal, so the lean is toward continued weakness with a modest downside target.
This is educational analysis and not financial advice.