MU 6-day bearish forecast — Nov 8, 2026
- Bias: Bearish
- Timeframe: 6 days (made Nov 8, 2026, target date Nov 13, 2026)
- Price at analysis: $689.42
- Price target: $676.00
- Expected range: $658.00 – $710.00
- Result: Incorrect (+10.5%) — closed at $762.02 on Nov 13, 2026; quality score 0/100
Get a free AI analysis of MU today
Analysis
TECHNICAL INDICATORS
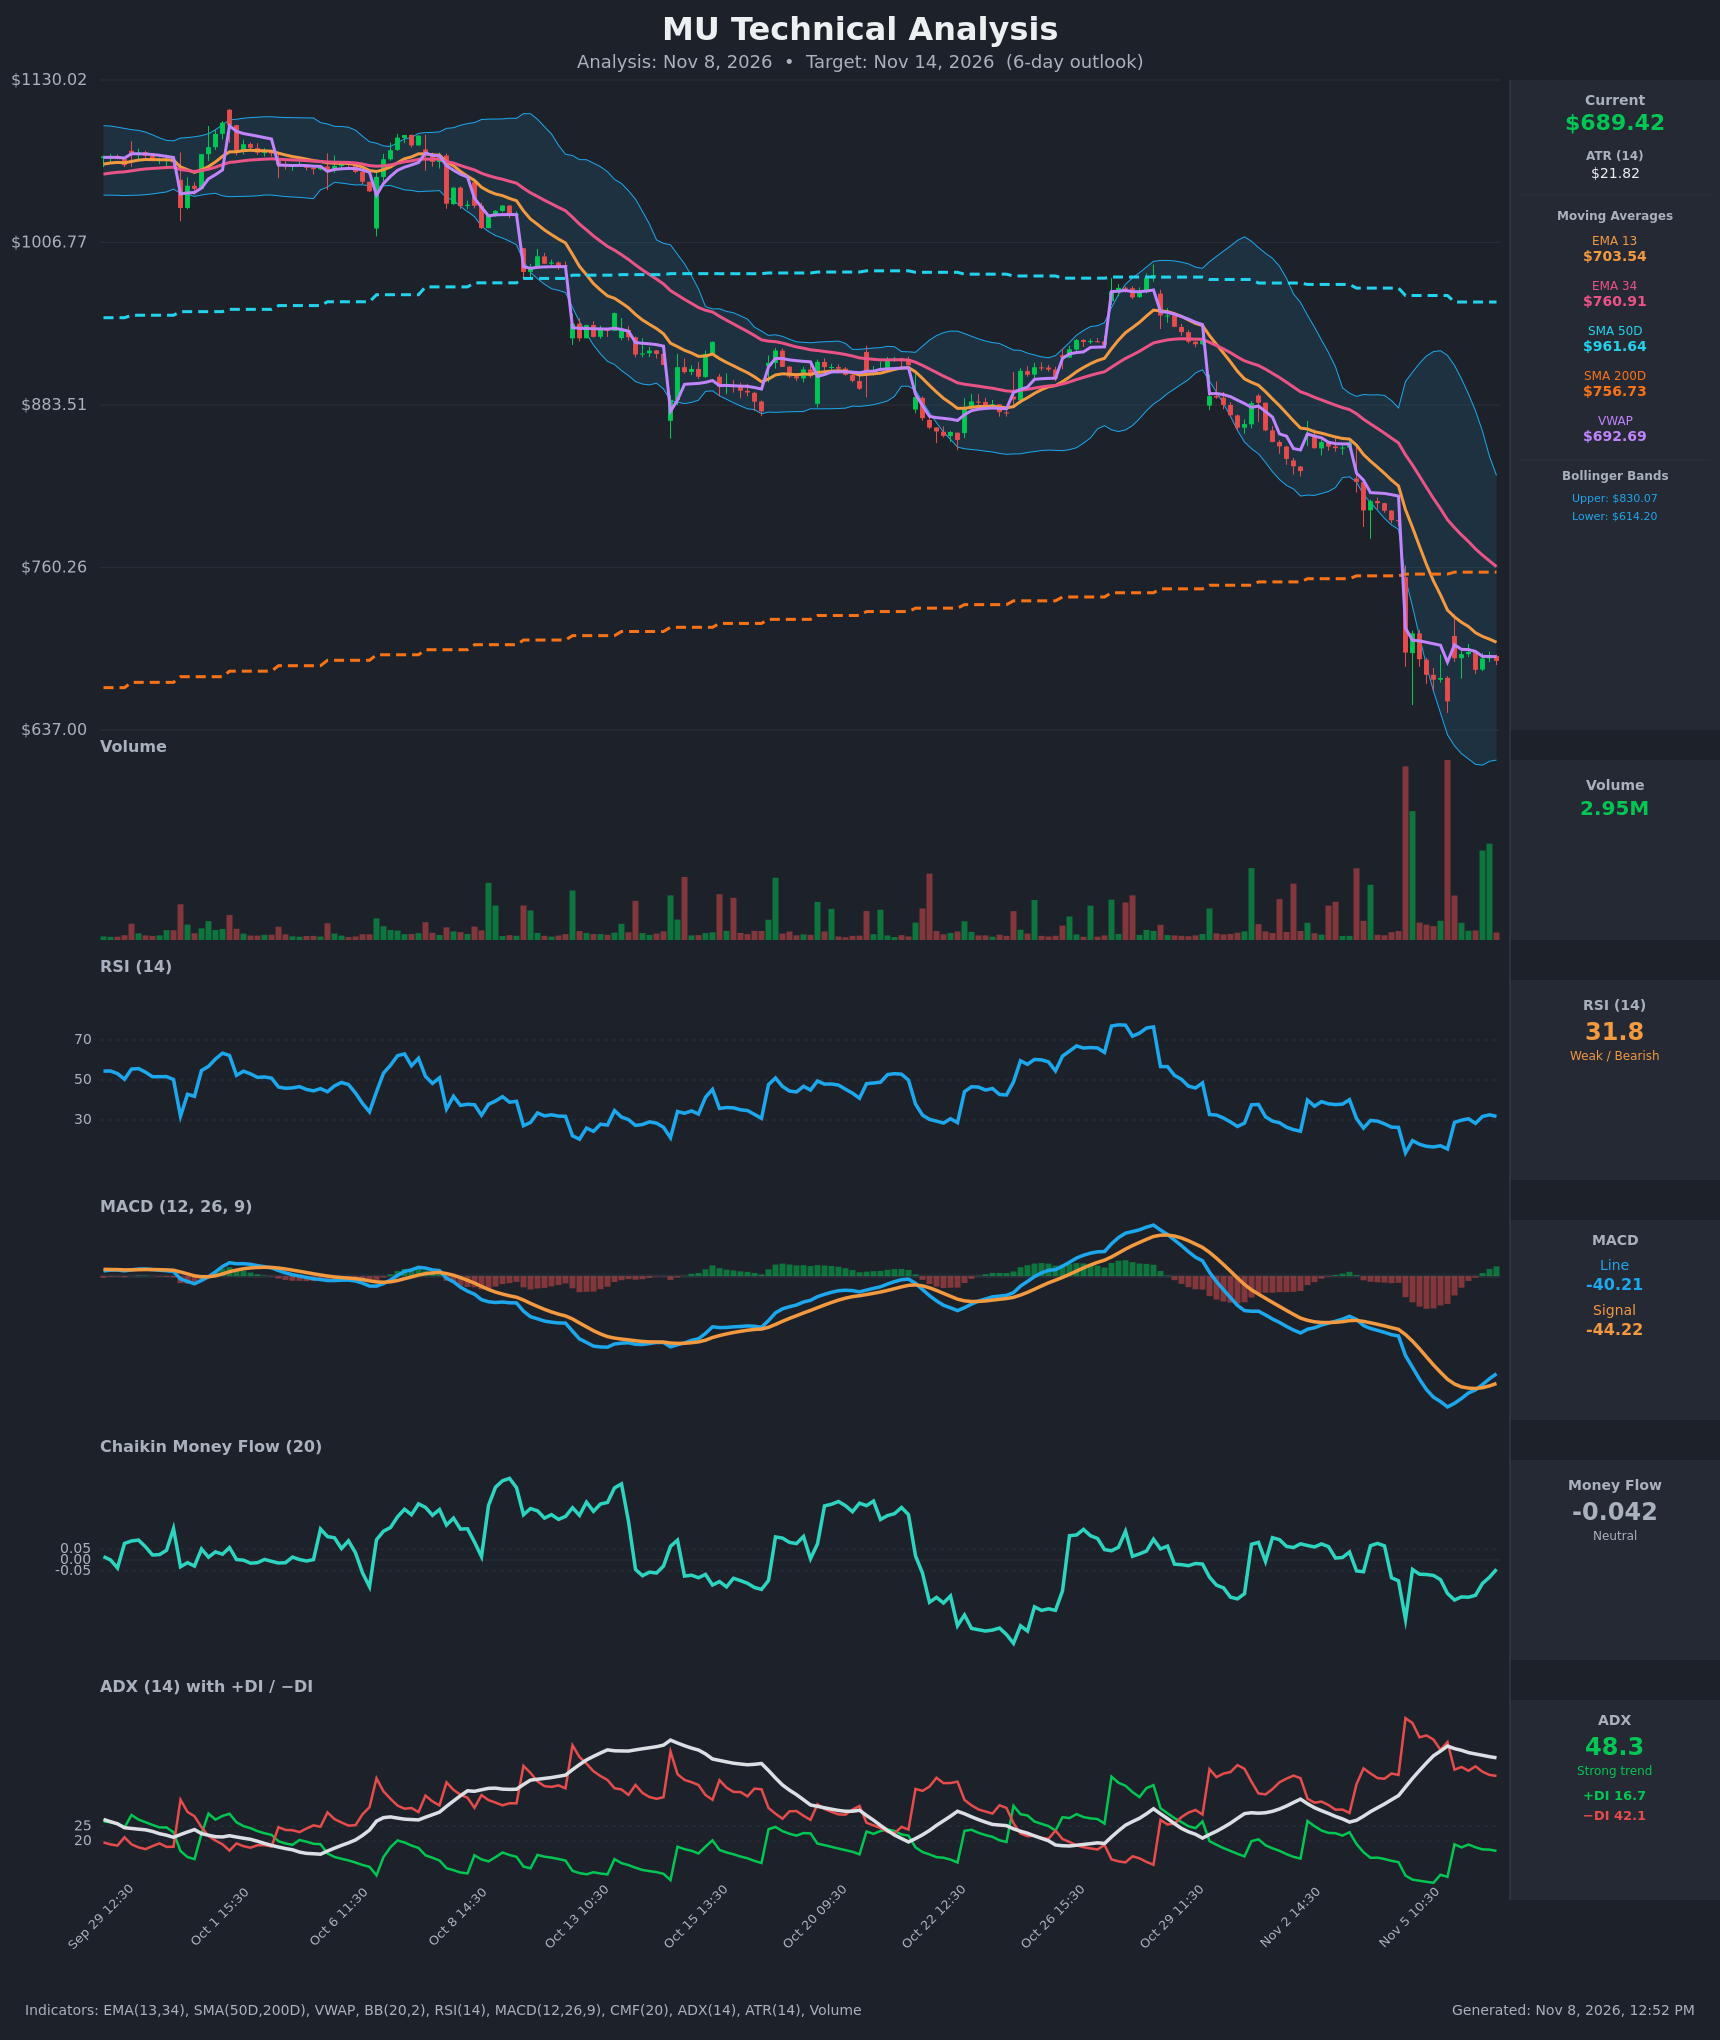
- RSI (14): 31.8, up from a capitulation low of 15.5 on Nov 5 but still below 50 and just above the 30 oversold line. Momentum has stopped falling, but the recovery is shallow and has stalled around 29-32 for the last 8 bars. [Neutral]
- 20 EMA: The data supplies EMA 13 ($703.54) and EMA 34 ($760.91). Price at $689.43 is below both, and both are still falling. EMA 13 is the first overhead resistance, about 2% above price, and EMA 34 is a stronger ceiling. [Bearish]
- MACD: Line -40.21 against signal -44.22, so the histogram is about +4. The line crossed above the signal at Nov 6 13:30, and the histogram has turned positive and is rising from a deeply negative trough. This is an early, weak bullish crossover far below zero, which is typical of a relief bounce rather than a trend change. [Neutral]
- Bollinger Bands (20): Bands are $614.20 to $830.07 and very wide after the crash. Price sits in the lower third, below the midline (about $722), and has pulled away from the lower band. This looks like a post-capitulation consolidation, with the midline as the bounce ceiling. [Bearish]
- CMF (20): -0.042, inside the neutral band (±0.05) and improving from -0.271 on Nov 5. Selling pressure has faded but there is no sign of accumulation yet. [Neutral]
- ADX (14): 48.3 with −DI 42.1 on top of +DI 16.7. ADX is very high but rolling over from a 52.3 peak. This is a strong bearish trend that may be maturing, though the DI spread is still heavily in the bears' favor. [Strong Trend – Bearish]
- Volume: 2.95M on the latest bar, far below the huge capitulation spikes of Nov 5. The most recent green volume bars are slightly elevated, which hints at some dip buying. Volume is fading on the consolidation, consistent with a pause rather than a reversal. Price is also slightly below VWAP ($692.69). [Neutral / Slightly Bearish]
DIVERGENCES & TRENDS
- Price made a low at $658.70 on Nov 5 with RSI at 15.5. The bounce to $696 had RSI at 28-32, so this is a momentum recovery, not a classic divergence. Price has not made a lower low since, while MACD has turned up, which is a mild bullish momentum improvement.
- The MACD bullish crossover (Nov 6 13:30) is a counter-trend signal far below zero and has not been confirmed by price breaking above EMA 13.
- Death cross status: SMA50D ($961.64) is far above SMA200D ($756.73), so it is not a death cross. Price is far below both, which confirms a deep long-term downtrend after a roughly 30% drop from the $1,000+ area.
- EMA 13 is below EMA 34 and the gap is widening, so the bearish structure is intact. Price is also below VWAP, a mild sign of selling pressure.
- ADX has peaked and is easing. This usually signals a pause or consolidation, not a reversal, until +DI crosses −DI.
CHART PATTERNS
- Over the last 8 bars price is range-bound between about $675 and $696 after a sharp vertical drop. This resembles a Bearish Pennant / Bearish Flag Pattern from the reference diagram, a continuation pattern after a steep decline.
- A break below the $675 base, and especially below the $658.70 low, would target a measured move of roughly $100 lower from the Nov 5 gap (about $590-$615, near the lower Bollinger Band) over a longer horizon. Within 6 days, a move toward $660-$670 is more realistic.
- The bullish alternative is a basing or Double Bottom attempt around $658-$675, which needs a close above EMA 13 ($703.54) to confirm.
POTENTIAL SCENARIOS
- Scenario 1: Bearish Pennant Breakdown — Price fails at the EMA 13/VWAP area, breaks the $675 consolidation floor, and the strong −DI trend resumes. Trigger: hourly close below $675 with rising volume. Target: $660-$665, with a possible retest of the $658.70 low. Invalidation: a close above $704. (45% probability)
- Scenario 2: Bullish Relief Bounce — Oversold RSI, the MACD crossover and improving CMF drive a mean-reversion bounce toward the EMA 13/Bollinger midline zone. Trigger: close above $703.54 (EMA 13). Target: $715-$722. Invalidation: a close below $675. (33% probability)
- Scenario 3: Neutral Range Chop — Price keeps consolidating between $675 and $700 as ADX cools. Trigger: failure of both the $675 and $704 breakouts. Target: $680-$695. Invalidation: a decisive close outside the $660-$710 area. (22% probability)
PRICE TARGETS
- Target Price: $676.00 (6-day outlook)
- Expected Range: $658.00 to $710.00 (width $52, about 7.5% of the current price, scaled for a 6-day horizon)
- Key Levels: Support at $658.70, Resistance at $703.54
OVERALL BIAS
OVERALL BIAS: BEARISH - Price is below every major moving average and VWAP, ADX is 48 with −DI dominant, and the tight consolidation after the crash looks like a bearish pennant. The MACD crossover and recovering RSI/CMF point to a possible bounce, but the bears hold the stronger evidence, so conviction is modest.
This is educational analysis and not financial advice.