MU 4-day bullish forecast — Nov 8, 2026
- Bias: Bullish
- Timeframe: 4 days (made Nov 8, 2026, target date Nov 11, 2026)
- Price at analysis: $689.42
- Price target: $705.00
- Expected range: $672.00 – $724.00
- Result: Correct (+15.3%) — closed at $795.15 on Nov 11, 2026; quality score 50/100
Get a free AI analysis of MU today
Analysis
TECHNICAL INDICATORS
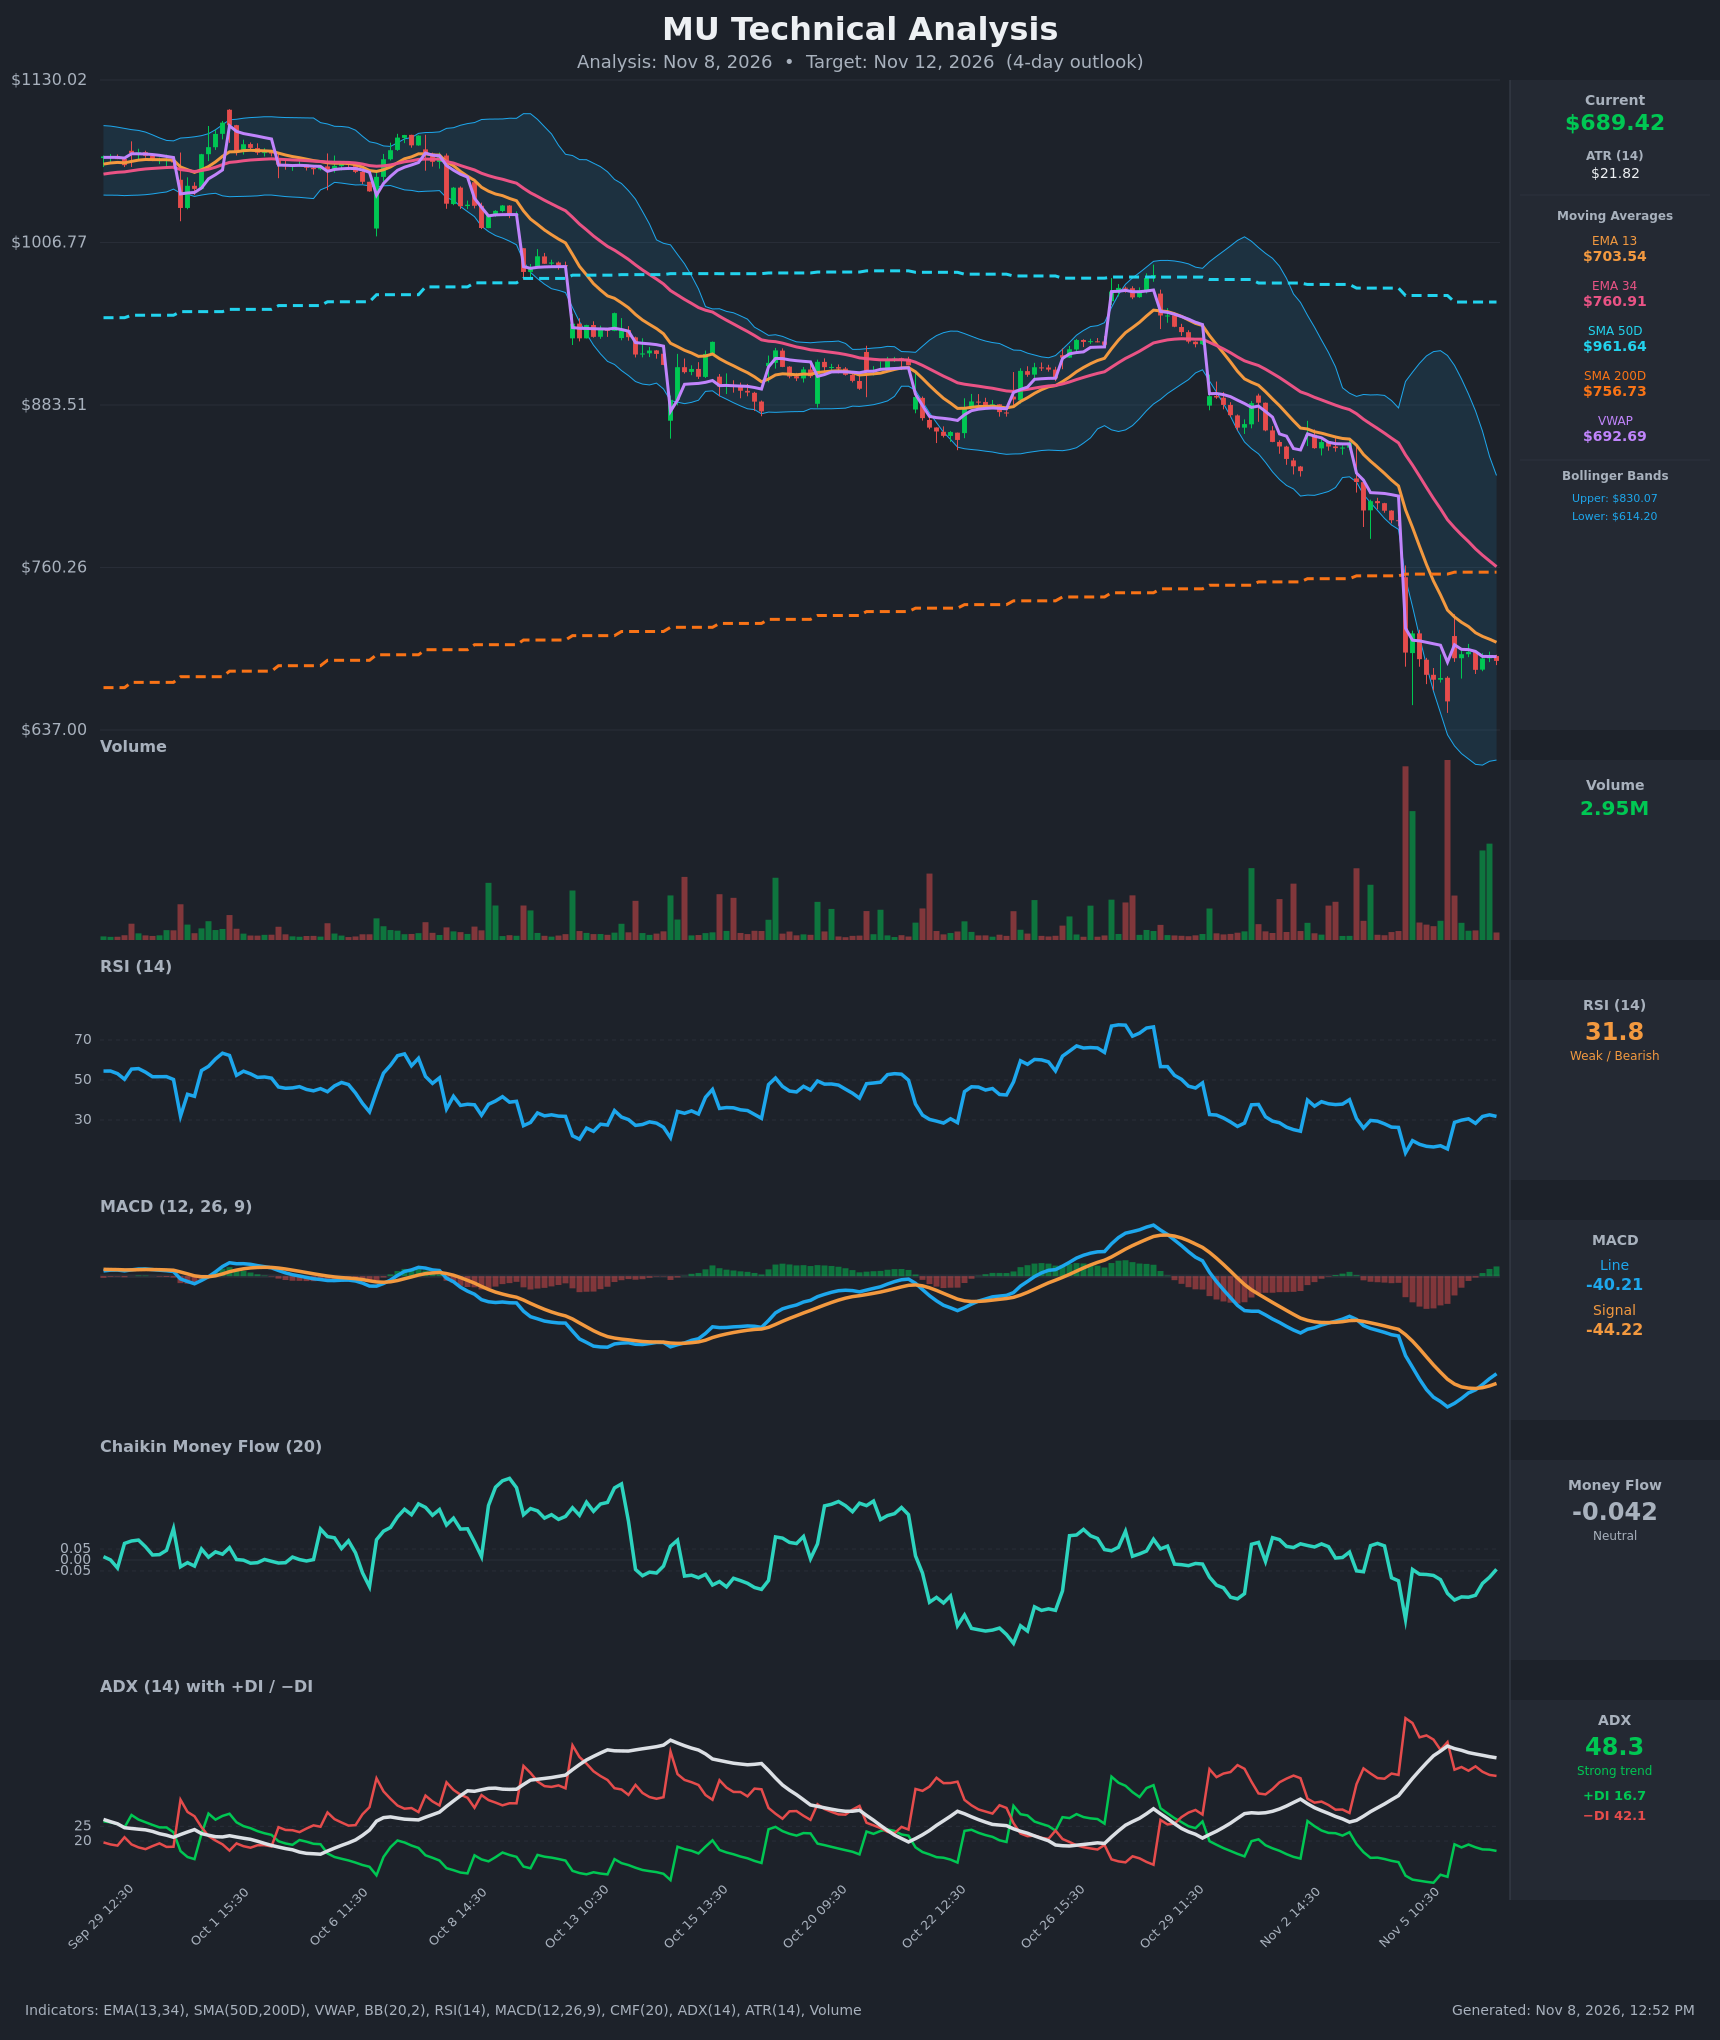
- RSI (14): 31.80, up from a 15.5 low on Nov 5 and hovering just above the 30 oversold line. Momentum is recovering from an extreme oversold reading, but RSI is still below 50 and has not confirmed a trend change. [Neutral]
- 20 EMA: The data supplies EMA 13 ($703.54) and EMA 34 ($760.91) instead. Price at $689.43 is below both, and EMA 13 is below EMA 34 (a bearish alignment). EMA 13 at $703.54 is the first overhead resistance, and the gap to EMA 34 is still widening. [Bearish]
- MACD: Line -40.21 is above Signal -44.22, a small positive histogram of about +4. The line crossed above the signal around Nov 6 13:30 after bottoming near -53.9. This is a bullish crossover, but it is deep below zero, so it signals a relief bounce rather than a trend reversal. [Bullish]
- Bollinger Bands (20): Upper $830.07, lower $614.20, middle roughly $722. The bands are very wide after the gap-down, so volatility is elevated. Price sits in the lower half of the bands (about 35% of the width), having walked the lower band and then pulled away. The bands are still pointing down, which is not a reversal signal. [Neutral]
- CMF (20): -0.042, inside the neutral zone (±0.05). It has improved from -0.271 on Nov 5 and -0.182 on Nov 6, so selling pressure is easing, but there is no accumulation yet. [Neutral]
- ADX (14): 48.3 with −DI 42.1 well above +DI 16.7. This is a very strong downtrend. ADX has started to roll over slightly from its 52.3 peak, which suggests the downtrend is maturing rather than reversing. Bears are still in control. [Strong Trend – Bearish]
- Volume: 2.95M on the latest bar. This is modest against the massive capitulation spikes around Nov 5. The last few bars show green volume picking up on the bounce, while the selling spikes have faded. This suggests selling exhaustion, though buying conviction is not yet strong. [Neutral / early stabilization]
DIVERGENCES & TRENDS
- RSI: Price made its low at $658.70 with RSI at 15.5. Price is now about 4.7% higher with RSI doubled to ~32. This is an early momentum recovery, not a classic divergence, because price has not made a new low.
- MACD: The bullish line/signal cross and rising histogram show downside momentum fading. It remains well below zero.
- VWAP: Price ($689.43) is almost exactly at VWAP ($692.69), so the market is balanced in the short term after the gap.
- Moving averages: Price is below the 200-day SMA ($756.73) and well below the 50-day SMA ($961.64), which is still falling. No death cross has formed, since the 50-day is still above the 200-day, but the gap is closing quickly. The EMA 13/34 bearish alignment remains intact.
- CMF: The trend is improving (-0.27 to -0.04) but has not crossed positive.
- ADX/DI: −DI dominates. The DI spread has narrowed from 61.7 vs 8.3 to 42.1 vs 16.7, so downside pressure is easing.
CHART PATTERNS
- Bearish Pennant/Flag (continuation): After the sharp gap-down from ~$795 to ~$695, price has consolidated in a tight $658–$710 range over the last several sessions. This resembles a bearish flag or pennant. A breakdown below $658.70 would project roughly $580–$600 (the flagpole is about $100).
- Capitulation / base attempt: The gap-down on huge volume, an RSI of 15, a bounce off the lows and a MACD cross suggest a possible short-term base. No reversal pattern from the reference diagram (double bottom, inverse H&S) has completed. A reclaim of $710 and then $722 (the Bollinger midline) would be the first sign of one.
- The structure is a consolidation inside a strong downtrend. The range is $658.70–$710, and the direction of the break matters more than the pattern itself.
POTENTIAL SCENARIOS
- Scenario 1: Bullish Oversold Relief Bounce — RSI near 30, a MACD bullish cross, improving CMF and fading sell volume support a mean-reversion move up to the declining moving averages. Trigger: hourly close above EMA 13 at $703.54 and then above $710. Target: $720–$730 (Bollinger midline and the gap-fill zone). Invalidation: close below $658.70. (45% probability)
- Scenario 2: Bearish Trend Continuation (Flag Breakdown) — ADX at 48 with −DI dominant and price below all key moving averages. The consolidation resolves lower as a bearish flag and sellers re-take control. Trigger: break below $675 and then $658.70 on rising volume. Target: $620–$630 (near the lower Bollinger Band at $614). Invalidation: close above $710. (40% probability)
- Scenario 3: Neutral Range Chop — Price keeps oscillating between about $660 and $705 as the market digests the gap. Trigger: failure to break either $658.70 or $710. Target: $680–$695. Invalidation: close outside the $655–$712 range. (15% probability)
PRICE TARGETS
- Target Price: $705.00 (4 days from now)
- Expected Range: $672.00 to $724.00 (width $52, about 7.5% of the current price, consistent with the 4-day guidance)
- Key Levels: Support at $658.70, Resistance at $703.54 (with $722–$730 behind it)
OVERALL BIAS
OVERALL BIAS: BULLISH - The extreme oversold RSI recovery, MACD bullish crossover, improving CMF and fading capitulation volume favor a modest relief bounce toward the EMA 13 and the $705–$720 area. Conviction is modest because the ADX of 48 with −DI dominant and the bearish flag structure keep a downside break a close second scenario.
This is educational analysis and not financial advice.