META 6-day bearish forecast — Nov 8, 2026
- Bias: Bearish
- Timeframe: 6 days (made Nov 8, 2026, target date Nov 13, 2026)
- Price at analysis: $610.12
- Price target: $603.00
- Expected range: $586.00 – $620.00
- Result: Incorrect (+4.4%) — closed at $637.15 on Nov 13, 2026; quality score 10/100
Get a free AI analysis of META today
Analysis
TECHNICAL INDICATORS
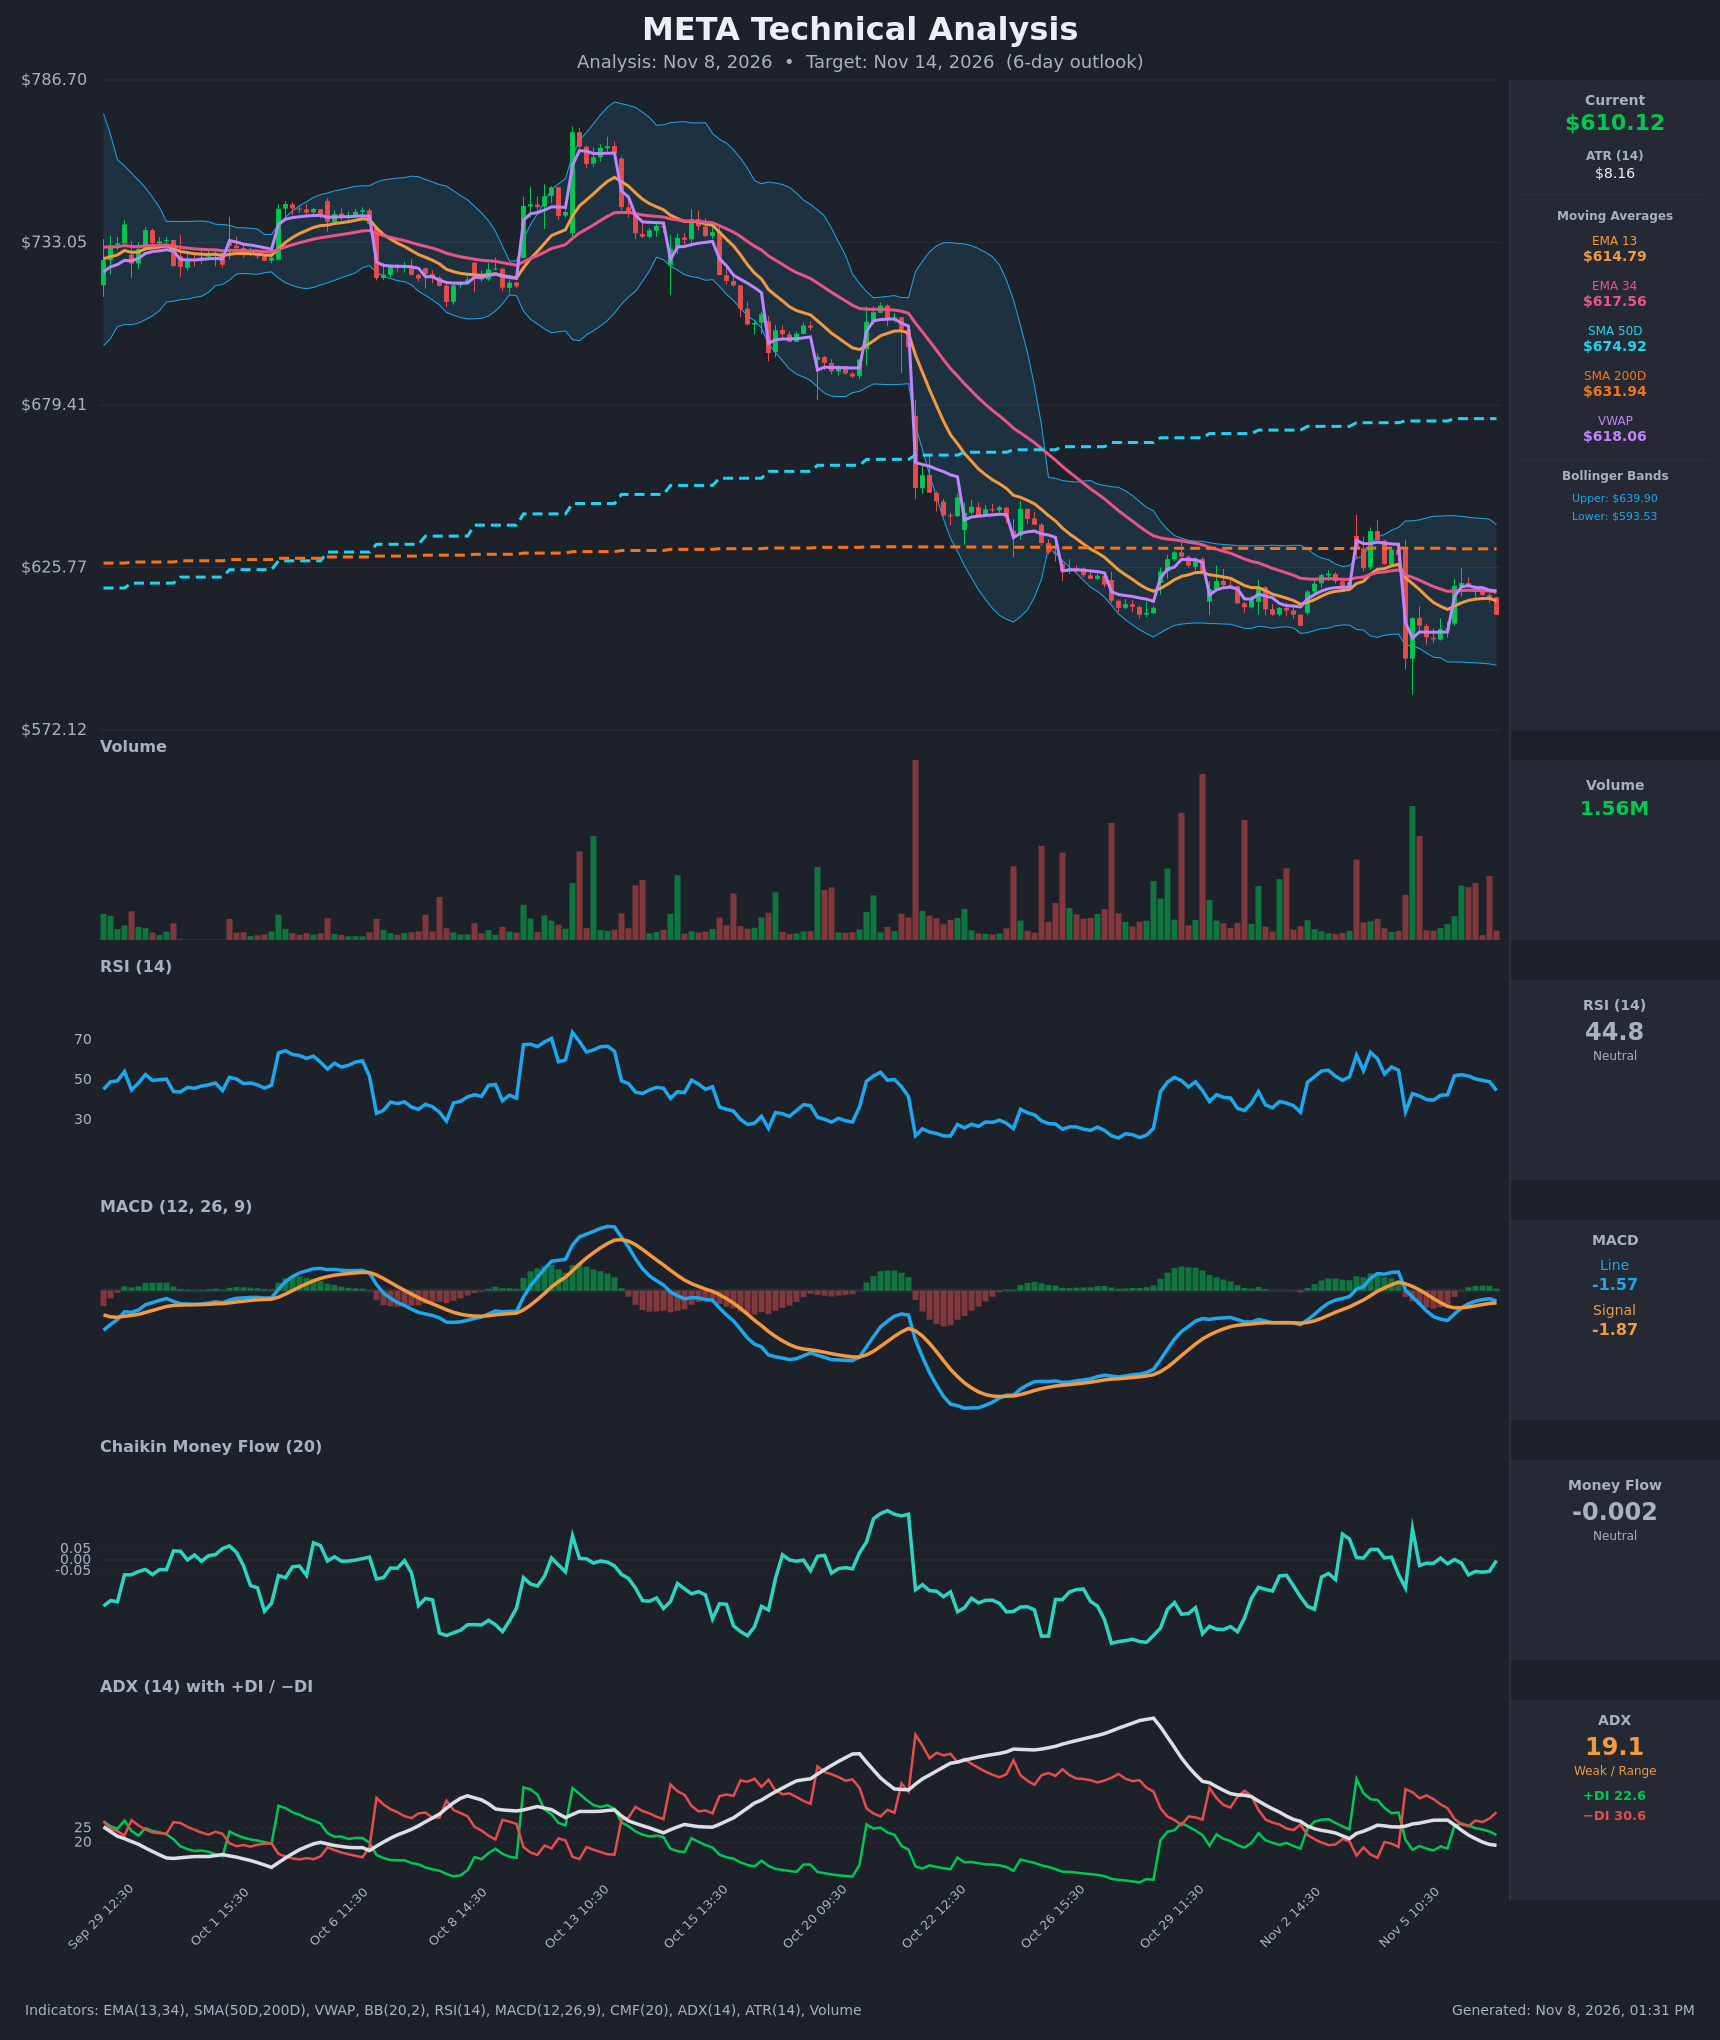
- RSI (14): 44.76, rolling over from 52.7 on Nov 6 10:30 to 44.8 on the last bar. It is below the 50 midline but well above oversold, so momentum is mildly negative with room to fall. [Bearish]
- 20 EMA: The data gives EMA 13 at $614.79 and EMA 34 at $617.56 (no 20 EMA). Price at $610.12 is below both, and EMA13 is below EMA34, so the short-term trend is down and both act as overhead resistance. [Bearish]
- MACD: Line -1.57, signal -1.87, so the histogram is only marginally positive (+0.30). The line crossed above the signal on Nov 6 10:30. It ticked down on the last bar (-1.23 to -1.57), and the gap is shrinking, which points to a possible bearish re-cross. The reading is below zero, so the bounce is weak. [Bearish]
- Bollinger Bands (20): Upper $639.90, lower $593.53, middle about $616.7. Price sits in the lower half of the bands, below the midline, and the bands are fairly narrow after the Nov 5 gap. The lower band is the nearest downside magnet. [Bearish]
- CMF (20): -0.002, inside the ±0.05 neutral zone and oscillating around zero. There is no clear accumulation or distribution. [Neutral]
- ADX (14): 19.1 and falling from about 27.8, so the trend is weak or range-bound. −DI (30.6) is above +DI (22.6) and has been since the Nov 5 drop, with the gap widening again in the last three bars. Bears have a mild edge. [Weak Trend, bearish lean]
- Volume: 1.56M on the latest bar, which is average to below average. The Nov 5 gap-down came on a large green/red volume spike that has not been repeated. The bounce lacked conviction, and the latest red bar adds to the selling. [Neutral to mildly bearish]
DIVERGENCES & TRENDS
- No significant divergences: RSI and MACD are confirming price rather than diverging from it.
- Trend structure: The long-term trend from the $780s peak is down. It has stepped lower in gaps, with Nov 5 the latest. Price remains below SMA200 ($631.94) and far below SMA50 ($674.92). SMA50 is still above SMA200, but it is flat to rising only because of lagging older data, so it carries little forward weight.
- Crossovers: EMA13 stays below EMA34 (a bearish alignment since Nov 5). MACD made a small bullish cross on Nov 6 that is fading. VWAP ($618.06) was lost on the last bar, which was a rejection from $620.65.
- Momentum: ADX is falling, so the selling pressure of the gap-down is cooling. Price is stabilizing in a $595–$621 range, but each bounce is capped by the declining EMAs.
CHART PATTERNS
- Bearish Flag / Pennant (continuation): After the sharp Nov 5 gap-down, price has consolidated in a tight range with lower highs below the EMAs. A breakdown below $600 would project roughly another $20–25 lower (the flagpole is about $35). The pattern is not clean, so confidence is moderate.
- Possible Double Bottom (reversal) near $595–$600: The Nov 5 low and the potential retest are a tentative basing structure. It is only confirmed on a close above about $621 and then the SMA200 at $631.94, which has not happened.
- The larger picture is a downtrend with lower highs. The weak ADX also hints at a sideways range, but the lean is down.
POTENTIAL SCENARIOS
- Scenario 1: Bearish Flag Breakdown — Price keeps getting rejected at the EMA13/34 and VWAP zone and rolls into the lower Bollinger Band. Trigger: close below $600 and the MACD re-crossing below signal. Target: $593.50, then $585. Invalidation: sustained close above $620. (50% probability)
- Scenario 2: Neutral Range Chop — Price stays pinned between $595 and $620 with weak ADX and flat CMF. Trigger: failure to break either $595 or $620. Target: $600–$612. Invalidation: a close outside the range. (20% probability)
- Scenario 3: Bullish Double-Bottom Reversal — Price holds $595–$600, reclaims VWAP and the EMAs, and squeezes toward the SMA200. Trigger: close above $621 with RSI above 55. Target: $631.94, then the BB upper at $639.90. Invalidation: close below $593. (30% probability)
PRICE TARGETS
Timeframe: 6 days (Nov 14, 2026). The range is $34 wide, or 5.6% of the current price, which fits the guide for a short timeframe.
- Target Price: $603.00
- Expected Range: $586.00 to $620.00
- Key Levels: Support at $593.53, Resistance at $618.06
OVERALL BIAS
OVERALL BIAS: BEARISH - Price is below the EMA13/34, VWAP and SMA200, −DI leads +DI, RSI is rolling over, and the small MACD bounce is fading. The weak ADX and neutral CMF limit conviction, so expect a modest drift toward the lower Bollinger Band rather than a collapse.
This is educational analysis and not financial advice.