META 4-day bearish forecast — Nov 8, 2026
- Bias: Bearish
- Timeframe: 4 days (made Nov 8, 2026, target date Nov 11, 2026)
- Price at analysis: $610.12
- Price target: $603.00
- Expected range: $590.00 – $618.00
- Result: Incorrect (+2.4%) — closed at $624.70 on Nov 11, 2026; quality score 27/100
Get a free AI analysis of META today
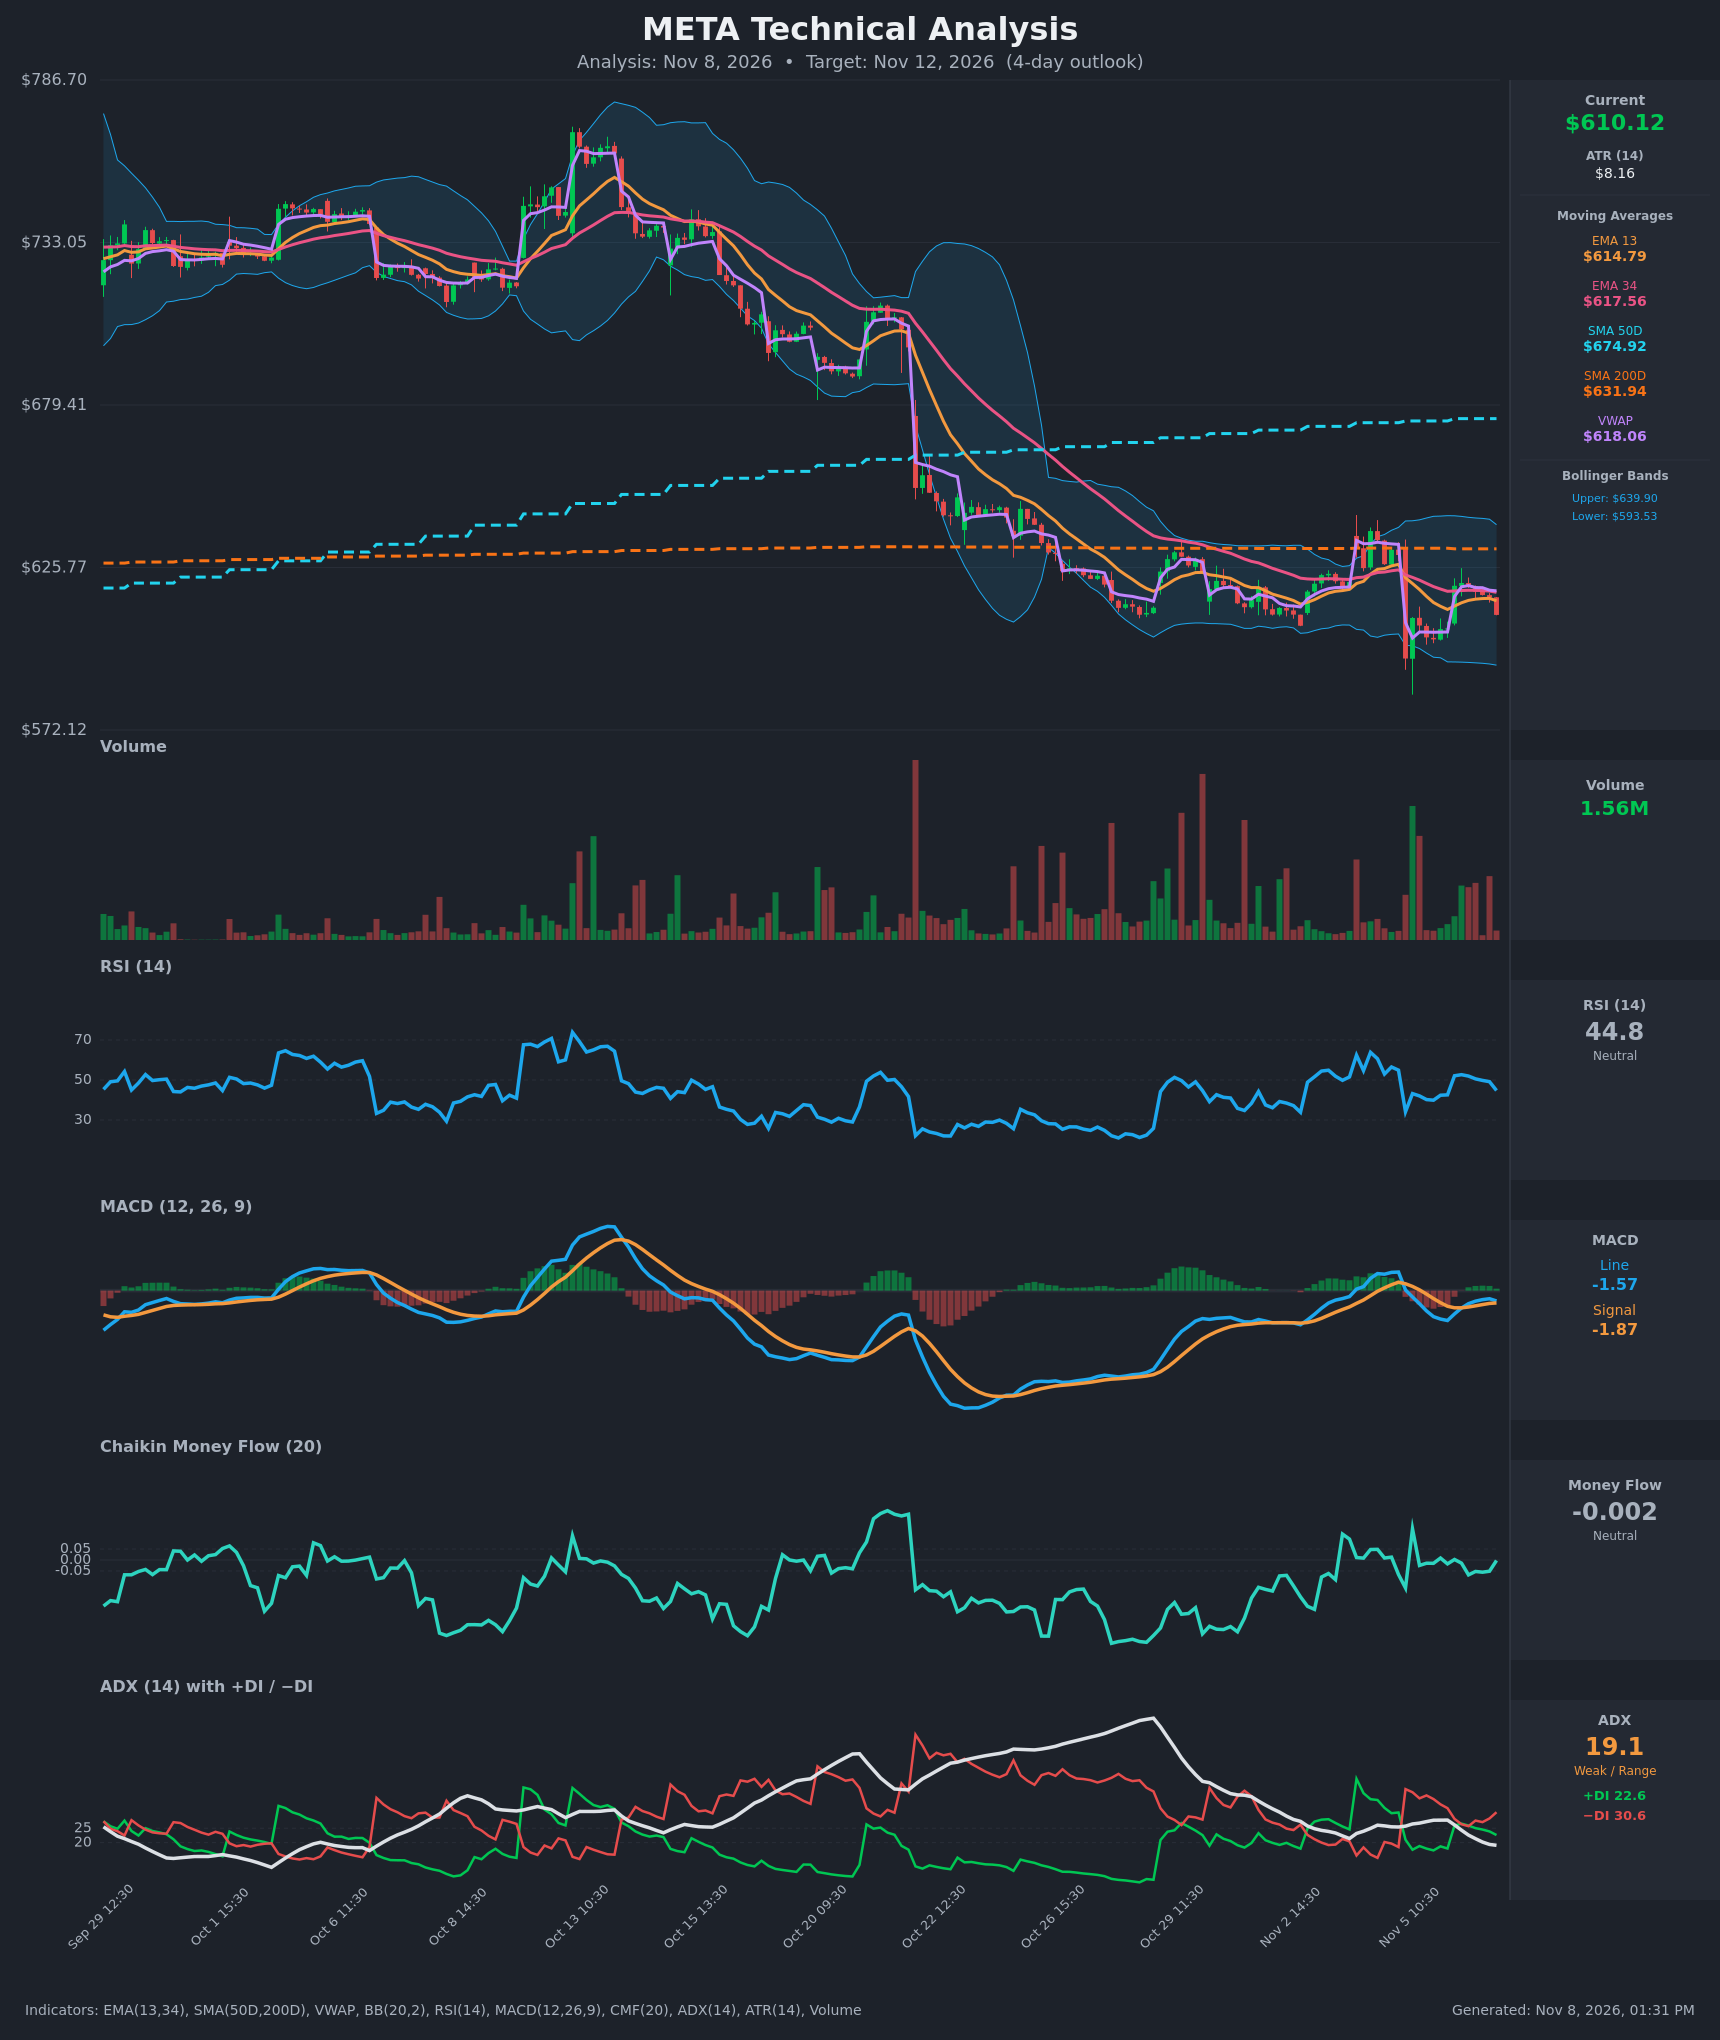
Analysis
TECHNICAL INDICATORS
- RSI (14): 44.76, down from ~52 on Nov 6 open and 49 an hour earlier. It is below the 50 midline with momentum turning down, but far from oversold (30). [Bearish]
- 20 EMA: The data provides EMA 13 ($614.79) and EMA 34 ($617.56), not a 20 EMA, so I use them as proxies. Price at $610.12 is below both, and EMA 13 is below EMA 34, so the short-term averages act as overhead resistance. [Bearish]
- MACD: Line -1.57 is just above signal -1.87, so the histogram is slightly positive (~+0.30). The bullish crossover on Nov 6 morning is fading: the histogram has shrunk from ~+0.75 to +0.30 in two bars, and both lines are below zero. A re-cross lower is close. [Bearish]
- Bollinger Bands (20): Upper $639.90, lower $593.53, midline about $616.7. Price is in the lower half, about 37% of the way up the band. The bands are fairly narrow after the Nov 5 gap, and price is rejecting the midline. [Bearish]
- CMF (20): -0.002, inside the ±0.05 neutral zone. There is no accumulation or distribution edge, and the reading hovers around zero. [Neutral]
- ADX (14): 19.1 and falling from ~28, so trend strength is weak. −DI (30.6) is above +DI (22.6), and the gap has re-widened over the last few bars, so bears have the slight directional edge. [Weak Trend, bearish lean]
- Volume: 1.56M on the last bar, which is red. The highest recent volume was the Nov 5 gap-down and rebound; the latest bars show mild selling activity with no capitulation. [Mildly Bearish]
Moving-average context:
- Price is below SMA200D ($631.94) and well below SMA50D ($674.92).
- SMA50D is above SMA200D, so there is no death cross yet, but the gap is a major overhead barrier.
- Price is also below VWAP ($618.06).
DIVERGENCES & TRENDS
- Divergences: No clear divergence. RSI and MACD are both making lower highs from the Nov 6 morning bounce, in line with price.
- Trend:
- The long-term trend is down, from ~$780 to ~$610.
- Price is now consolidating just above the Nov 5 gap low (~$595 close, wick lower).
- The relief bounce to $620.65 stalled just under VWAP and EMA 34, and price has since rolled over.
- Crossovers and breaks:
- The MACD bullish cross on Nov 6 is losing steam.
- The DI spread is re-widening in favor of −DI after +DI briefly led (+DI 26.6 vs −DI 26.4).
- Price lost EMA 13 and EMA 34 on the last bar.
- ADX below 20 signals chop, so moves may be modest.
CHART PATTERNS
- Primary read: A bearish flag / pennant-like consolidation after the sharp drop from the $730s to the $600s. The Nov 5 gap-down sits at the bottom of a small range around $595–$632, with lower highs from Nov 4 ($629.89) to $620.65. A break below $593–595 would target roughly the measured move of the range, about $570–575.
- Less likely read: A bullish falling-wedge or double-bottom style base near $595–$600. That needs a close above $620–$632 (VWAP, EMA 34, SMA200D) to confirm, and there is no confirmation yet.
- Significance: With ADX at 19, the consolidation is unresolved. The bearish read has the edge from the lower highs and the position below all key averages.
POTENTIAL SCENARIOS
- Scenario 1: Bearish Rollover Toward Range Lows — Price rejected at EMA 34/VWAP, MACD re-crosses down, and −DI stays dominant, pushing price to retest the lower band and the Nov 5 lows. Trigger: a hold below $610 and an hourly close under $605. Target: $598 first, then $593.50 (lower BB), with an extension to ~$588. Invalidation: an hourly close above $618 (VWAP/EMA 34). (50% probability)
- Scenario 2: Neutral Range Chop — Weak ADX keeps price between the Nov 5 lows and the moving-average cluster. Trigger: repeated tests of $600–$618 with no volume expansion. Target: $605–$615. Invalidation: a close below $593 or above $625. (30% probability)
- Scenario 3: Bullish Relief Rally to SMA200D — Oversold-style bounce from the lower band as MACD holds above signal, reclaiming VWAP and the EMAs. Trigger: a close above $618 on rising volume. Target: $625–$632 (SMA200D). Invalidation: a drop back below $605. (20% probability)
PRICE TARGETS
- Target Price: $603.00 (4-day horizon, Nov 12)
- Expected Range: $590.00 to $618.00 (width $28 ≈ 4.6% of price, consistent with a 4-day horizon, wider than a 2–3 day range and narrower than a 7–10 day range; roughly 3.4 ATRs)
- Key Levels: Support at $593.53, Resistance at $617.56
OVERALL BIAS
OVERALL BIAS: BEARISH - Price is below EMA 13/34, VWAP, SMA200D and SMA50D. RSI is rolling over below 50, the fading MACD histogram is near a bearish re-cross, and −DI leads +DI. CMF is neutral and ADX is weak, so the expected move is modest, toward the $593–$600 area.
This is educational analysis and not financial advice.