ASTS 4-day bullish forecast — Nov 8, 2026
- Bias: Bullish
- Timeframe: 4 days (made Nov 8, 2026, target date Nov 11, 2026)
- Price at analysis: $32.30
- Price target: $32.85
- Expected range: $31.20 – $33.40
- Result: Correct (+11.5%) — closed at $36.01 on Nov 11, 2026; quality score 50/100
Get a free AI analysis of ASTS today
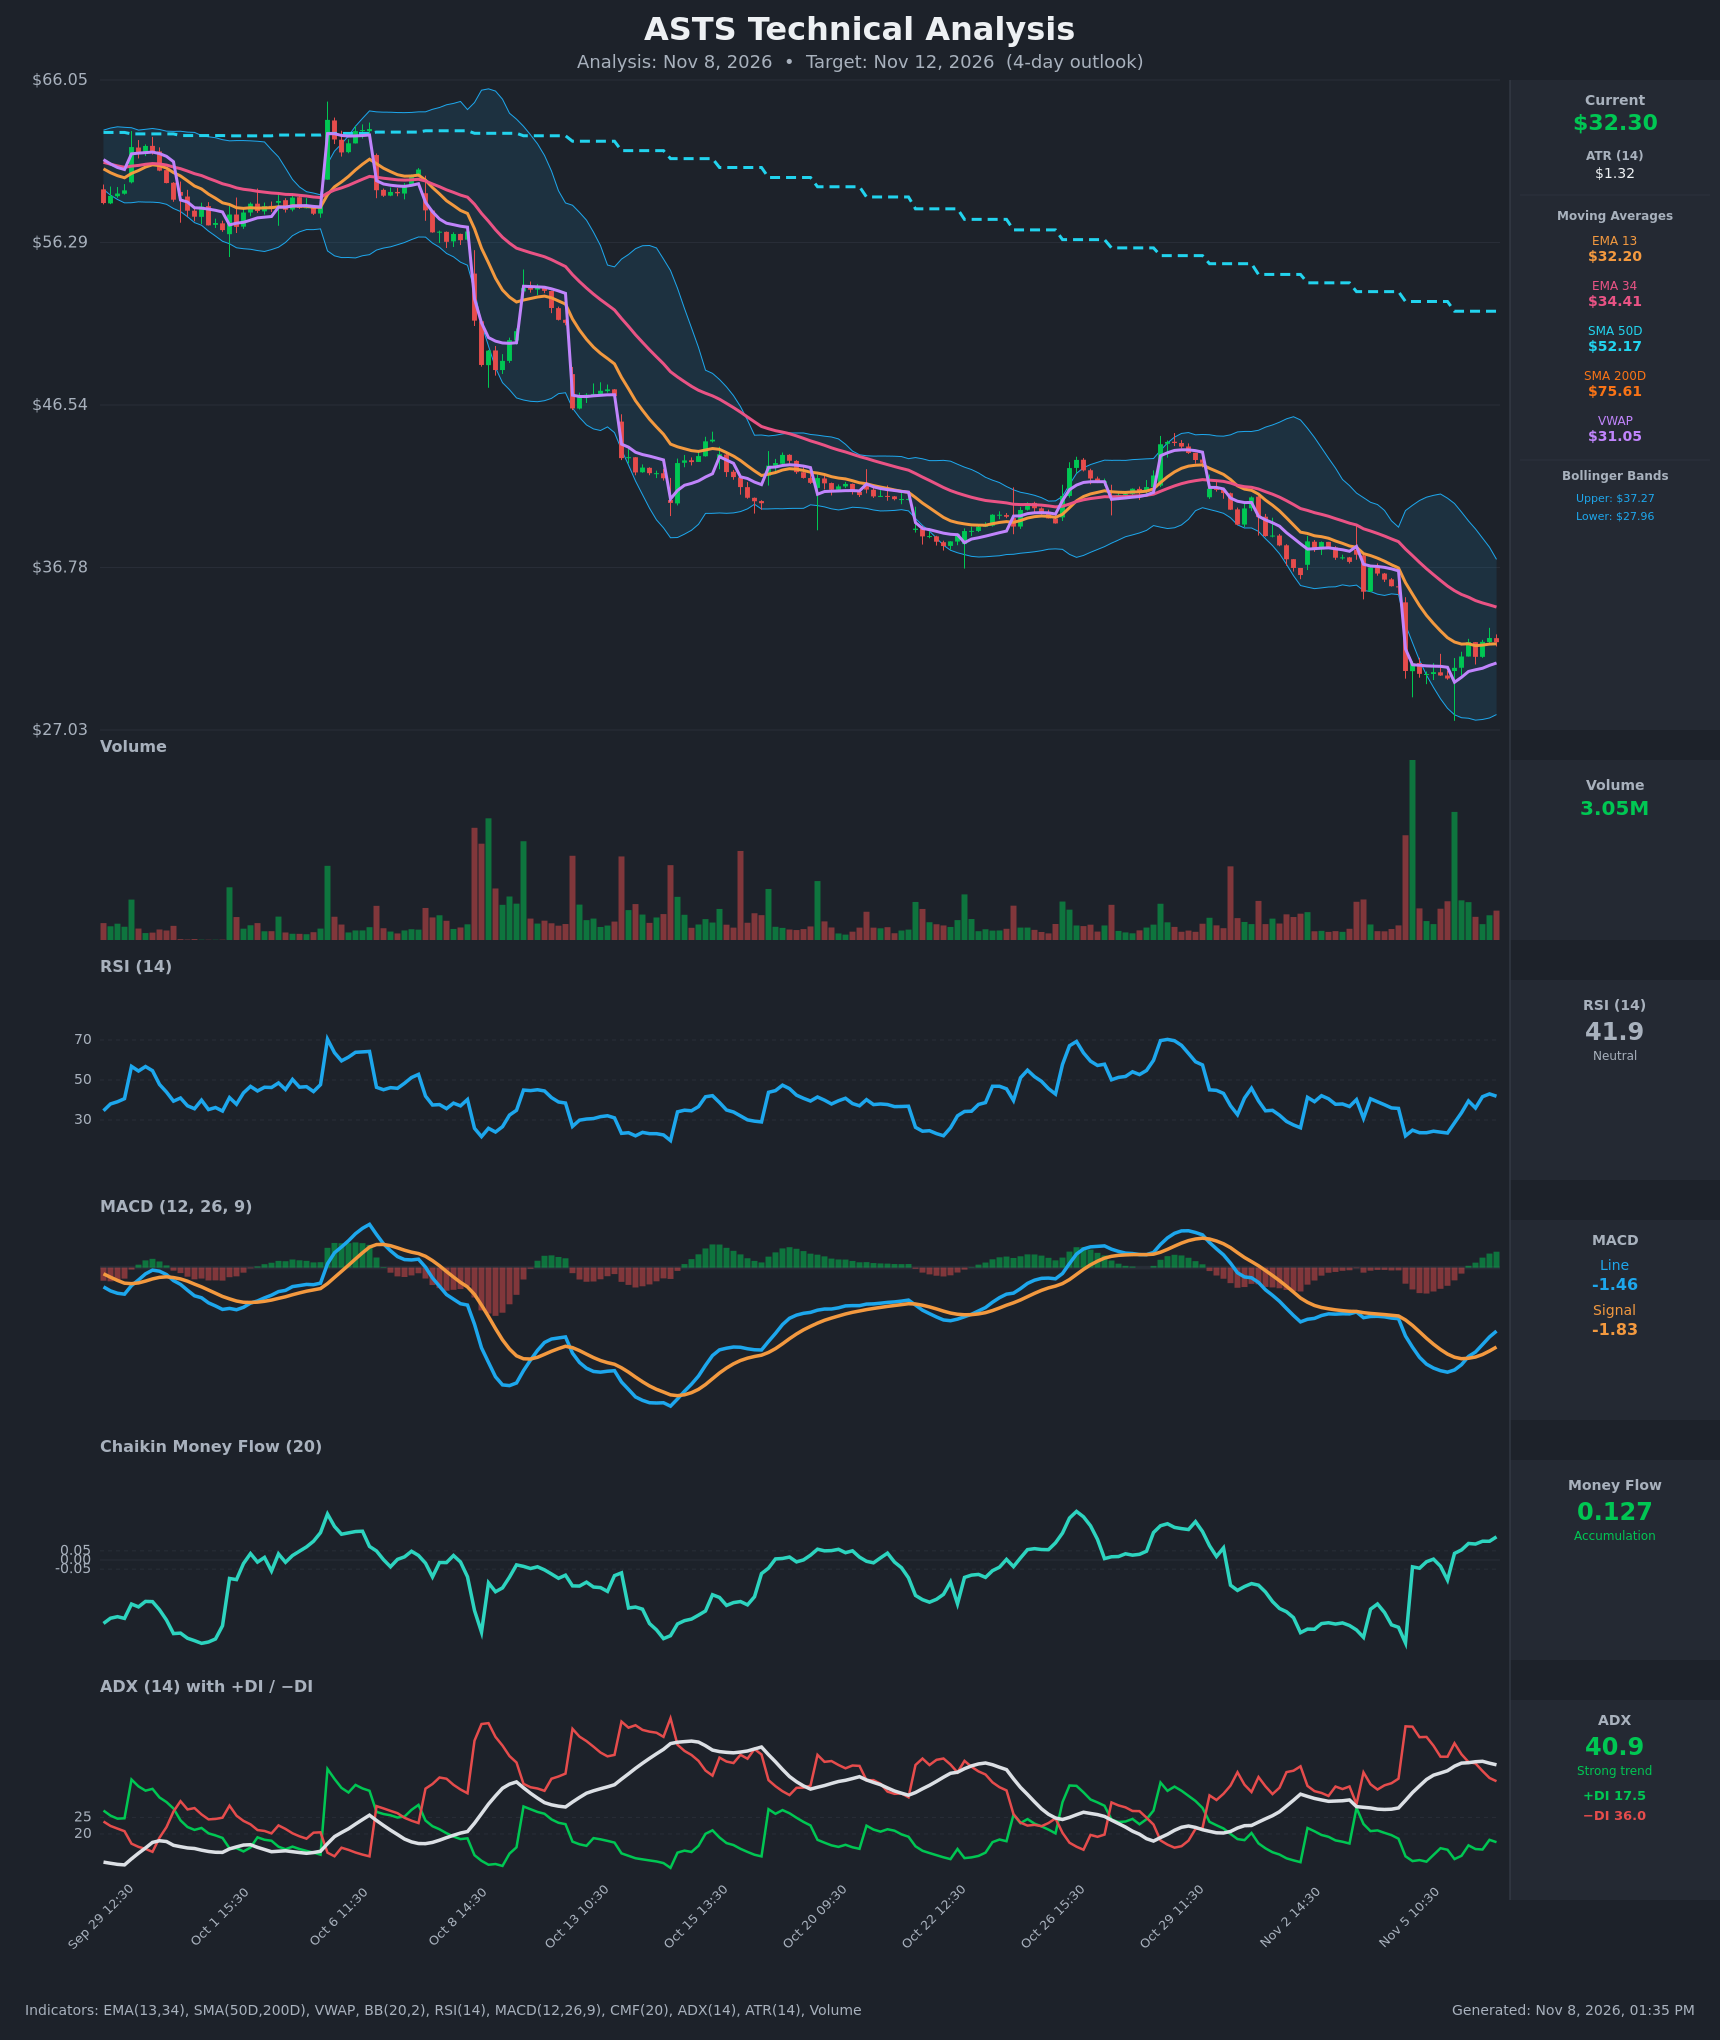
Analysis
TECHNICAL INDICATORS
- RSI (14): 41.88, rebounding sharply from the 22-24 oversold zone on Nov 5 and now back near the mid-40s. Momentum is improving but is still below 50, which is where downtrend rallies often stall. [Neutral]
- EMA 13 / EMA 34: EMA13 is $32.20 and price ($32.30) sits just on top of it, so it is acting as near-term support. EMA34 is $34.41 and falling, and EMA13 remains well below it (bearish alignment). The $34.41 level is overhead resistance. [Neutral]
- MACD: The line (-1.46) is rising fast toward the signal (-1.83), and the histogram has flipped positive. A bullish crossover is imminent, but both lines are deeply negative, so this is a relief bounce inside a downtrend. [Bullish]
- Bollinger Bands (20): Upper is $37.27, lower is $27.96, and the midline is roughly $32.6. Price bounced off the lower band after the Nov 5 flush and now sits just under the midline. The bands are wide after the volatility spike. A reclaim of the midline would open the way toward $34-35. [Neutral]
- CMF (20): 0.127, firmly above +0.05 and rising over the last several sessions. This is buying pressure on the bounce, and it is a constructive sign after the capitulation selling. [Accumulation]
- ADX (14): 40.9 with −DI (36.0) well above +DI (17.5). This is a strong downtrend. −DI is easing off its 52 peak and +DI is edging up, so selling pressure is fading, but the bears are still in control. [Strong Trend – Bearish]
- Volume: 3.05M, a modest level compared with the capitulation spikes on Nov 5. Recent up-bars carry slightly better volume than the down-bars, which is mildly supportive of the bounce. The bounce is not yet backed by a surge in volume. [Mildly Bullish / Unconfirmed]
- Other reference levels: Price is above VWAP ($31.05), a short-term positive. It is far below SMA50 ($52.17) and SMA200 ($75.61), and the SMA50 is below the SMA200 (death cross), so the long-term trend is firmly bearish. [Bearish long-term]
DIVERGENCES & TRENDS
- The long-term trend is clearly down: a staircase of lower highs and lower lows from about $64 to about $30. The SMA50 and SMA200 are both falling, and price is far below both.
- A gap-down flush on Nov 5 (heavy volume, RSI 22) was followed by a base at about $30.1-30.5 and a 2-day recovery to $32.3.
- There is no classic price/RSI divergence at the lows, but the oversold RSI plus the CMF turning positive suggests short-term seller exhaustion.
- MACD is about to cross up (histogram positive). The ADX is flat to slightly falling from its high, and −DI is rolling over, which suggests the downtrend is pausing.
- The EMA13/EMA34 gap is narrowing (32.20 vs 34.41, down from a much wider gap). There is no bullish EMA cross yet, and price is not above the EMA34.
CHART PATTERNS
- The most relevant reference pattern is a Bearish Flag / Falling Wedge-type relief bounce after a sharp markdown. The bounce from $30.1 is a corrective retracement within a larger downtrend.
- If the rebound is a bearish flag, a rollover below $30.1 would target about $27.9 (the lower Bollinger Band and the measured flush low).
- If the rebound holds above VWAP and reclaims the BB midline (~$32.6), it could extend toward the EMA34 at $34.4 (about a 38% retrace of the recent leg).
- There is no confirmed reversal pattern such as a double bottom, and the long-term structure is still bearish.
POTENTIAL SCENARIOS
- Scenario 1: Bullish Relief Bounce Continues — MACD crosses up and CMF accumulation carries price through the BB midline toward EMA34 resistance. Trigger: hold above $32.2 (EMA13) and a close above $32.65. Target: $33.30-$34.40. Invalidation: close below $31.05 (VWAP). (45% probability)
- Scenario 2: Bearish Trend Resumption — The rally fades near the BB midline or EMA34, −DI dominance reasserts itself, and price revisits the Nov 5 lows. Trigger: rejection at about $32.6-$33.5, then a break below VWAP at $31.05. Target: $30.10, then $28.0. Invalidation: close above $34.41. (40% probability)
- Scenario 3: Neutral Chop — Price oscillates between VWAP and the BB midline while indicators reset. Trigger: failure to break either $31.05 or $33.5. Target: $31.5-$33.0. Invalidation: close outside $30.5-$34.0. (15% probability)
PRICE TARGETS
- Target Price: $32.85 (4-day horizon, a modest extension of the bounce)
- Expected Range: $31.20 to $33.40 (width $2.20, about 6.8% of current price, consistent with a 4-day horizon)
- Key Levels: Support at $31.05 (VWAP; the Nov 5 low at about $30.10 is below), Resistance at $34.41 (EMA34; minor resistance at the BB midline of about $32.6)
OVERALL BIAS
OVERALL BIAS: BULLISH - Short-term evidence leans toward a continued relief bounce: price is above VWAP and EMA13, MACD is turning up, CMF shows accumulation, and RSI is recovering from deeply oversold. Conviction is modest because ADX/DI and the SMA structure remain strongly bearish, so upside is likely capped near the $34.4 EMA34.
This is educational analysis and not financial advice.