ASTS 6-day bullish forecast — Nov 8, 2026
- Bias: Bullish
- Timeframe: 6 days (made Nov 8, 2026, target date Nov 13, 2026)
- Price at analysis: $32.30
- Price target: $33.40
- Expected range: $31.20 – $33.90
- Result: Incorrect (-1.1%) — closed at $31.95 on Nov 13, 2026; quality score 38/100
Get a free AI analysis of ASTS today
Analysis
TECHNICAL INDICATORS
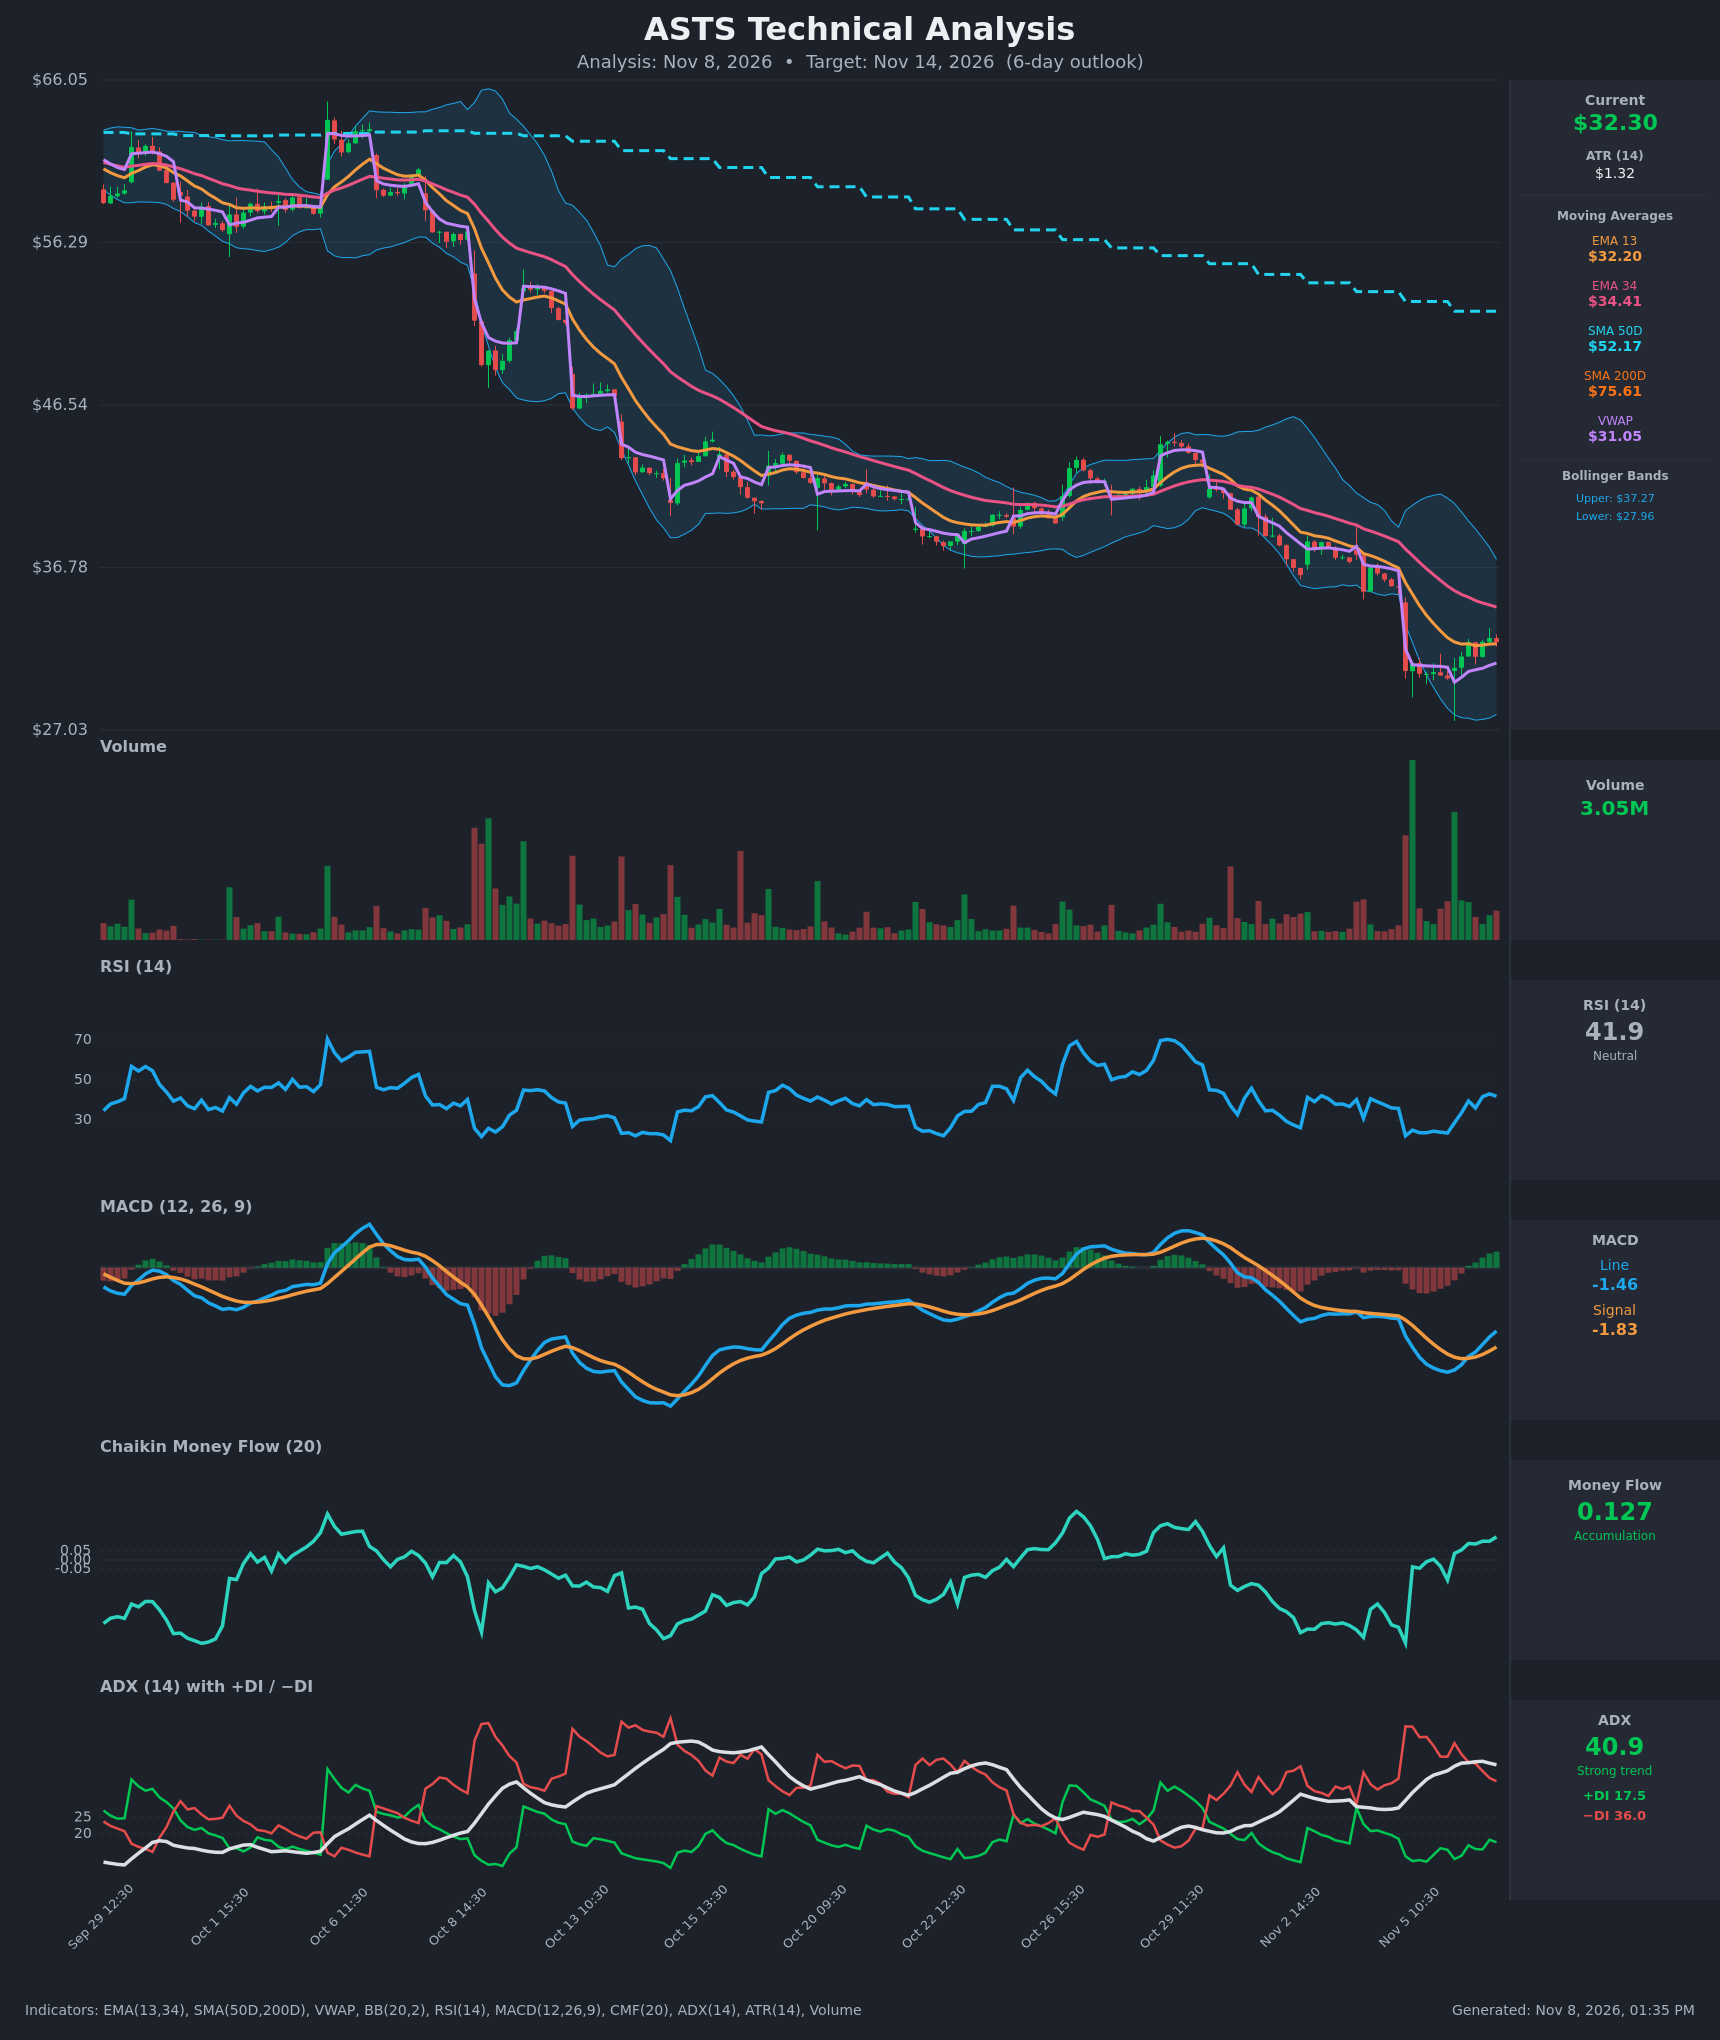
- RSI (14): 41.88, up sharply from a 22-24 oversold low on Nov 5. Momentum is recovering but still below 50, so the bounce hasn't reclaimed the neutral line. [Bullish]
- 20 EMA: Only the EMA 13 ($32.20) and EMA 34 ($34.41) are given. Price at $32.30 is just above the EMA 13, which now acts as marginal support. EMA 34 is overhead resistance and falling. Price is far below SMA50D ($52.17) and SMA200D ($75.61). [Neutral]
- MACD: Line -1.461 versus signal -1.827, so the histogram is positive and rising. The line has been climbing for six bars, and a bullish crossover occurred as the line moved above the signal. Both lines are still deeply negative, so it is a relief bounce rather than a trend reversal. [Bullish]
- Bollinger Bands (20): Upper $37.27, lower $27.96, midline about $32.6. Price rebounded from the lower band and sits just under the midline. The bands are wide after the capitulation drop. A midline reclaim opens the way toward $34-35, while a rejection points back toward the lower half. [Neutral]
- CMF (20): +0.127, rising from -0.45 on Nov 5 and above the +0.05 threshold. This shows real buying pressure and dip accumulation after the flush. [Accumulation]
- ADX (14): 40.9 with −DI 36.0 above +DI 17.5. The trend is strong and bearish. ADX is flattening and the DI spread has narrowed from 39 points to 18.5, which suggests the selling is losing force. [Strong Trend – Bearish]
- Volume: 3.05M, with a very large capitulation spike on the Nov 5 gap down and a second large green bar at the low. Recent bounce bars are on moderate volume. The heavy volume at the low suggests a selling climax, but the bounce volume is not yet convincing. [Neutral-to-Bullish]
DIVERGENCES & TRENDS
- Price made a lower low on Nov 5-6 (about $30.1), but CMF turned positive and RSI recovered from 23 to 42. This is an early bullish divergence in money flow.
- MACD crossed above its signal line while price is still below the declining EMA 34. EMA 13 is flattening and price has crossed back above it.
- No crossover has occurred between EMA 13 and EMA 34, which remain bearish (32.20 vs 34.41). The death cross (SMA50 below SMA200) is long established, and price is below SMA200 by about 57%.
- ADX above 40 with −DI dominant confirms the primary downtrend. +DI is rising slowly, but there is no bullish DI crossover.
- Price is above VWAP ($31.05), a short-term sign of buyers in control.
CHART PATTERNS
- The wider structure is a persistent downtrend of lower highs and lower lows. The Oct 29 bounce and subsequent drop resembled a Bearish Flag/Pennant continuation.
- After the capitulation low, the sequence of higher lows around $30-31 could form a small base or Bullish Falling Wedge-type reversal. It is not confirmed until price clears about $34.4 (EMA 34) and the falling trendline.
- Rebounds into the EMA 34 and Bollinger midline are the natural resistance zone. A failure there would complete a bearish-flag-style continuation, with a measured move back toward $28-30.
POTENTIAL SCENARIOS
- Scenario 1: Bullish Relief Bounce — Accumulation (CMF +0.127), the MACD cross and the recovery from oversold push price up toward the EMA 34 and the Bollinger midline/upper half. Trigger: hold above VWAP ($31.05) and a close above $32.80. Target: $33.40-$34.40. Invalidation: close below $30.40. (50% probability)
- Scenario 2: Bearish Rejection / Trend Continuation — The bounce stalls at the Bollinger midline or EMA 34 and the dominant −DI and strong ADX resume the downtrend. Trigger: rejection near $33-34.4 or a loss of VWAP and the EMA 13. Target: $29.50-$30.40, with a retest of the $27.96 lower band possible. Invalidation: close above $34.50. (38% probability)
- Scenario 3: Neutral Chop — Price consolidates between VWAP and the EMA 34 while the indicators reset. Trigger: low-volume, overlapping candles. Target: $31.50-$33.00. Invalidation: a break outside $30.40-$34.40. (12% probability)
PRICE TARGETS
- Target Price: $33.40 (6-day horizon)
- Expected Range: $31.20 to $33.90 (width $2.70, about 8.4% of current price, in line with a short 6-day window)
- Key Levels: Support at $31.05 (VWAP, with $30.10 recent lows below), Resistance at $34.41 (EMA 34)
OVERALL BIAS
OVERALL BIAS: BULLISH - Short-term momentum has turned up after a capitulation low: a positive MACD histogram, CMF accumulation at +0.127, RSI recovering from oversold, and price above VWAP and the EMA 13. Conviction is modest because the primary downtrend (ADX 40.9, −DI dominant, price far below the SMAs) caps upside near the $34.41 EMA 34.
This is educational analysis and not financial advice.