ASTS 13-day bearish forecast — Nov 8, 2026
- Bias: Bearish
- Timeframe: 13 days (made Nov 8, 2026, target date Nov 20, 2026)
- Price at analysis: $32.30
- Price target: $30.60
- Expected range: $28.80 – $32.60
- Result: Pending — graded after the close on Nov 20, 2026
Get a free AI analysis of ASTS today
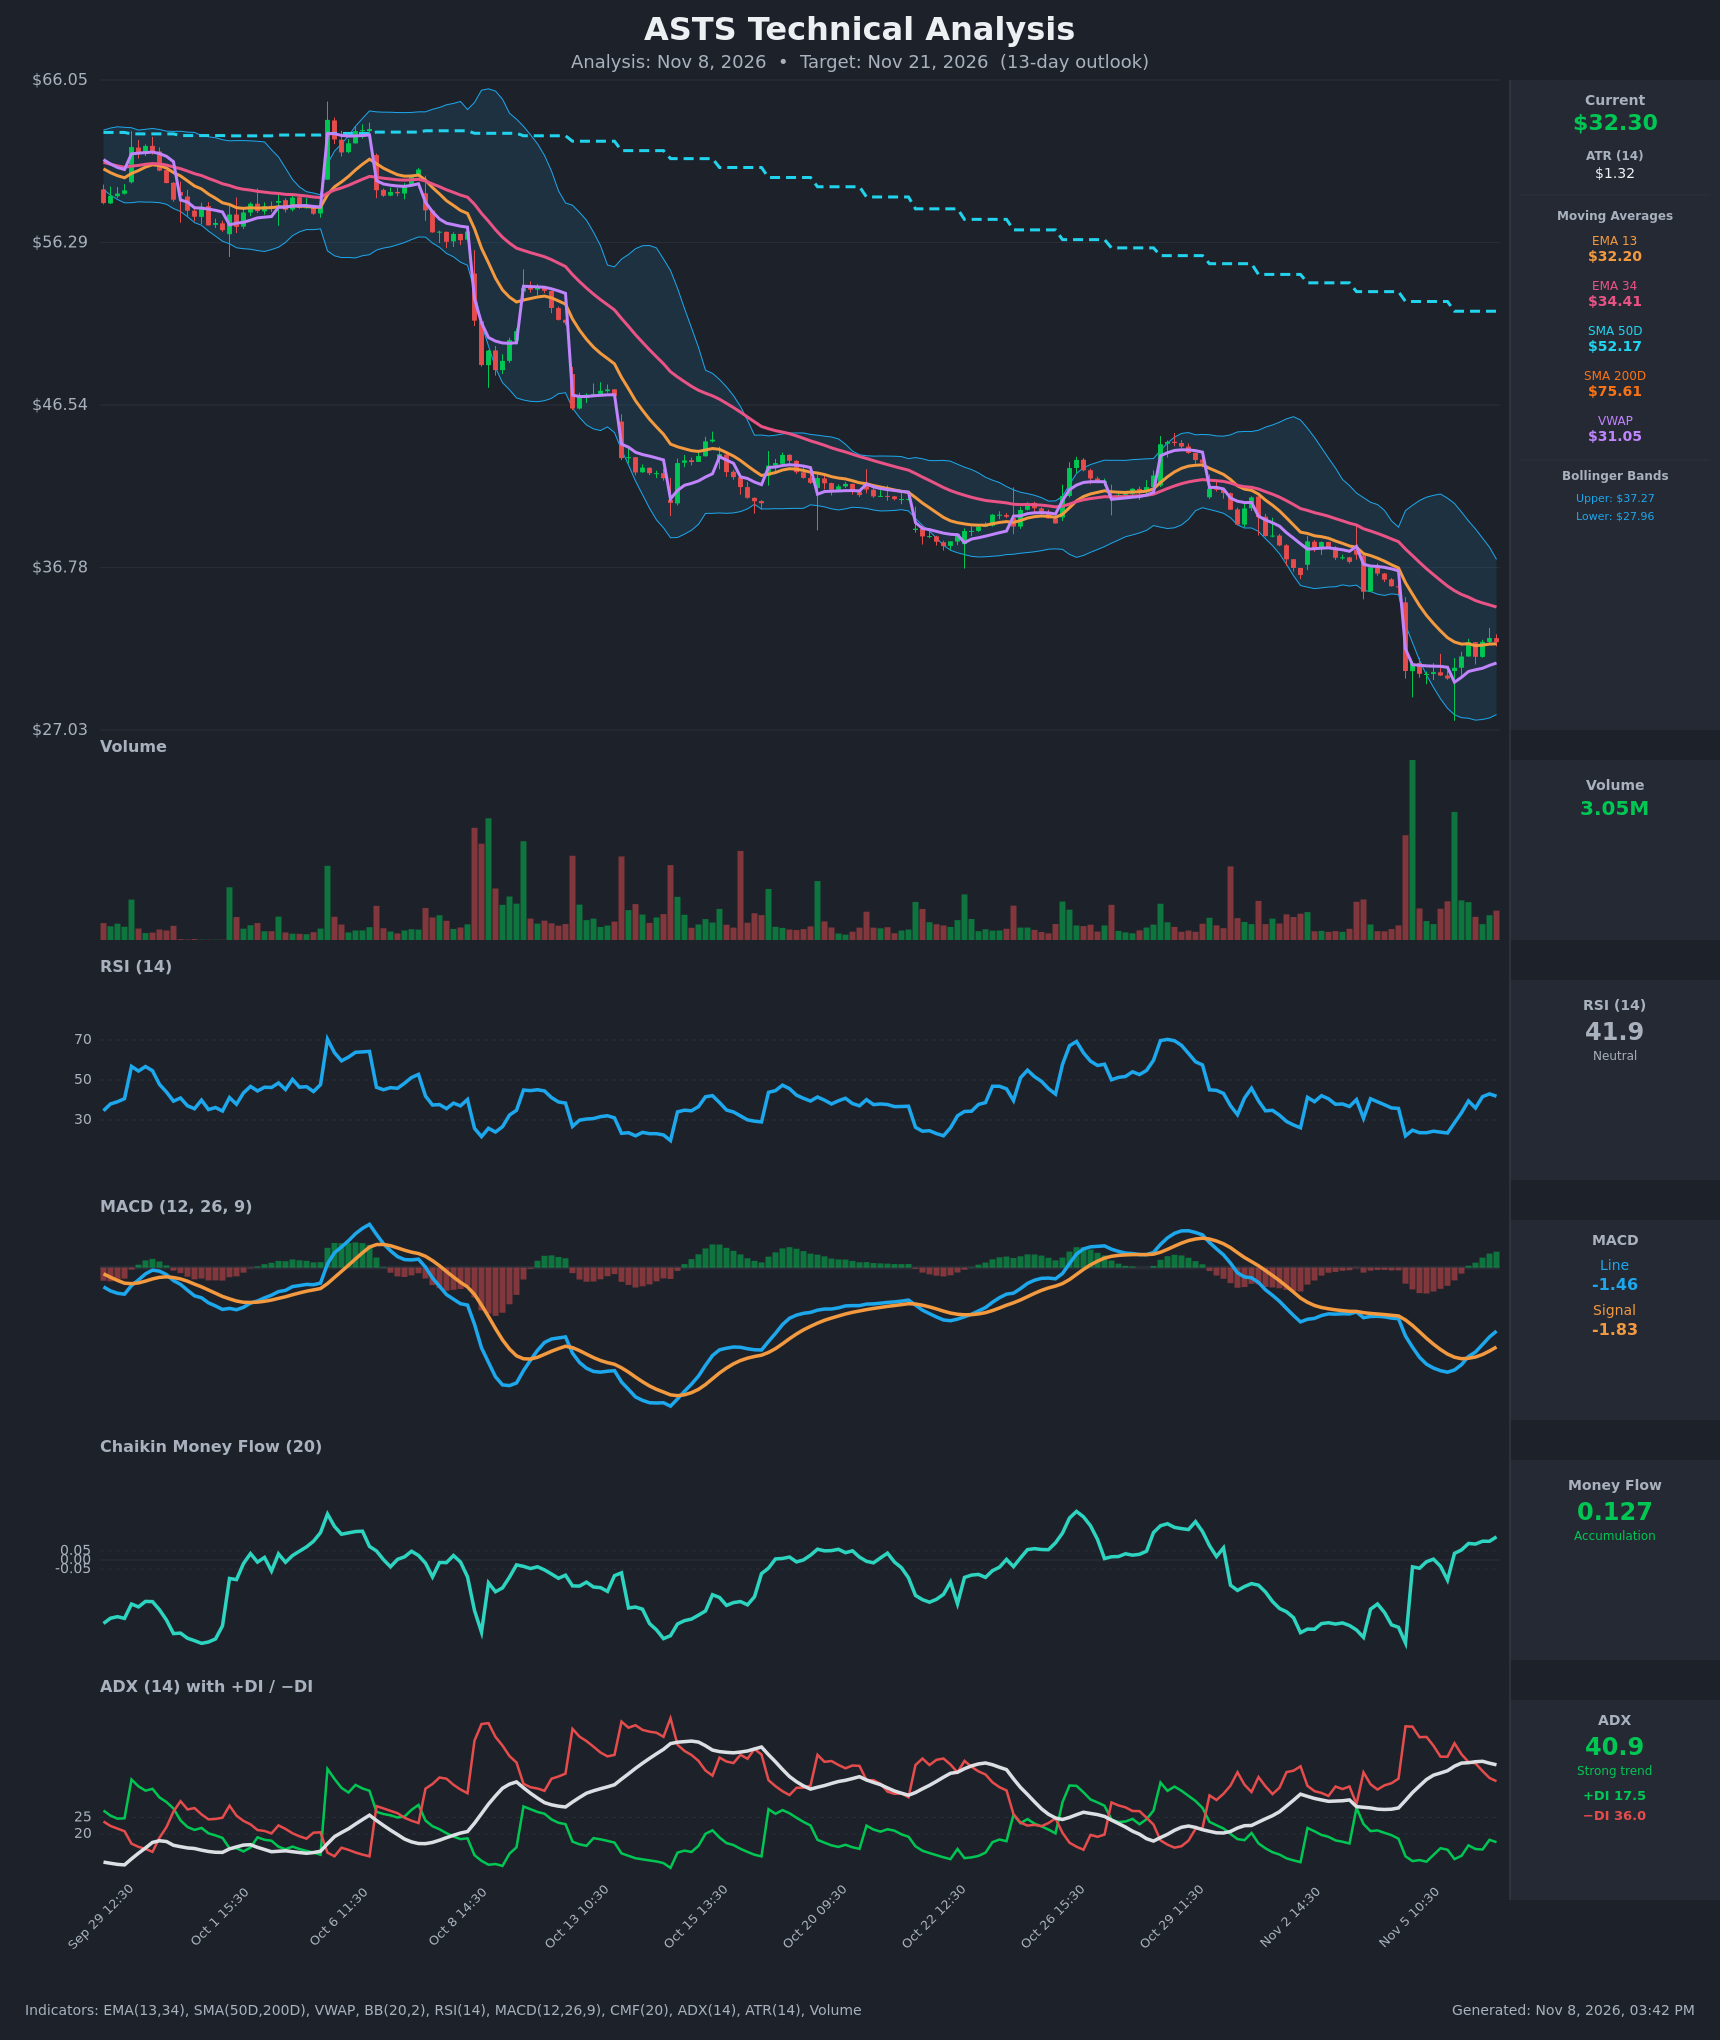
Analysis
TECHNICAL INDICATORS
- RSI (14): 41.88, up from a 22-24 washout on Nov 5 and now rising toward the 50 midline. Momentum is recovering from oversold but still sits below 50. [Neutral]
- EMA 13 / EMA 34: Price at $32.30 is just above EMA13 ($32.20), which is flattening, so short-term support is thin. EMA13 sits well below EMA34 ($34.41), and EMA34 is still falling, so it is the overhead resistance. [Bearish]
- MACD: Line -1.46 is below signal -1.83, but the histogram has turned positive and widened for several bars. A bullish crossover is imminent. It is occurring deep below zero, so it is more likely a relief bounce than a trend reversal. [Bullish]
- Bollinger Bands (20): Upper $37.27, lower $27.96, midline about $32.61. Price tagged the lower band during the Nov 5 flush and has bounced back to the midline. The bands are wide after the volatility spike, which fits a bounce within a downtrend. [Neutral]
- CMF (20): 0.127, up from -0.45 on Nov 5 and above the +0.05 threshold. Buyers stepped in after the capitulation, but this is a new reading and still needs confirmation from price. [Accumulation]
- ADX (14): 40.9 with -DI 36.0 above +DI 17.5. This is a strong trend, and the bears still control it. -DI is falling and +DI is ticking up, so the selling pressure is easing. [Strong Trend – Bearish]
- Volume: 3.05M, quiet compared with the huge capitulation bars on Nov 5. The bounce is on modest volume, so there is no strong conviction behind it yet. [Neutral/Weak bounce]
- Long-term MAs and VWAP: Price is far below SMA50D ($52.17) and SMA200D ($75.61). SMA50D is below SMA200D (death cross), and both are falling. Price is above VWAP ($31.05), which is a short-term positive. [Bearish]
DIVERGENCES & TRENDS
- The Nov 5 low in price (~$30 close) came with RSI near 22-24 and MACD still falling. There is no clear bullish divergence, only an oversold bounce.
- CMF has recovered to positive while price remains far below its moving averages. This is a mild positive divergence, but CMF rebounds have repeatedly faded during this decline.
- MACD is on the verge of a bullish crossover and the histogram is rising, which fits the pattern of earlier relief rallies.
- The trend is a series of lower highs and lower lows since October. The Oct 26-29 bounce to the mid-$40s failed at EMA34, which is the same type of barrier now near $34.4.
- ADX above 40 with -DI dominant means the trend is still down, even though DI spread is narrowing.
CHART PATTERNS
- Descending channel / lower highs, lower lows: This is the dominant structure, with a bearish continuation bias.
- Possible bearish flag: After the sharp Nov 5 drop, the modest drift higher resembles a bearish flag/pennant (Bearish Flag Pattern in the reference). A failure near EMA34/BB midline would project a measured move of roughly $3-5 below, toward the $27-28 area, near the lower Bollinger Band.
- There is no confirmed reversal pattern such as a double bottom or falling wedge. A move above $34.4-$35 would be the first sign of a base.
POTENTIAL SCENARIOS
- Scenario 1: Bearish Relief Rally Fails — The bounce stalls at the BB midline and EMA34 ($32.6-$34.4), then rolls over as -DI stays dominant and the bearish flag resolves down. Trigger: rejection at $33-$34.4 or a close below EMA13/VWAP (~$31). Target: $30.60, with a stretch to $28.0-$28.8 (lower band). Invalidation: a daily close above $35.0. (50% probability)
- Scenario 2: Bullish Oversold Bounce Extends — The MACD crossover and CMF accumulation carry price through EMA34. Trigger: a push above $34.4 on rising volume. Target: $36.0-$37.3 (upper Bollinger Band). Invalidation: a break below $30.0. (35% probability)
- Scenario 3: Neutral Consolidation — Price chops between VWAP and EMA34 while indicators reset. Trigger: failure to break either $30 or $34.4. Target: $31-$33. Invalidation: a close outside $29.5-$34.5. (15% probability)
PRICE TARGETS
For the 13-day horizon (Nov 21, 2026):
- Target Price: $30.60
- Expected Range: $28.80 to $32.60. This is $3.80 wide, about 11.8% of the current price, in line with the 8-12% guidance for 14-21 days and wider than a 2-3 day range.
- Key Levels: Support at $30.00 (Nov 5 lows; the lower Bollinger Band at $27.96 is the next level down), Resistance at $34.41 (EMA34).
OVERALL BIAS
OVERALL BIAS: BEARISH - A strong, bear-dominated downtrend (ADX 40.9, -DI 36 vs +DI 17.5) with price below the falling SMA50D, SMA200D and EMA34 favors the current bounce failing near $33-$34.4. The bullish MACD turn and positive CMF argue for a relief rally first, so conviction is modest.
This is educational analysis and not financial advice.