INTC 13-day bearish forecast — Nov 8, 2026
- Bias: Bearish
- Timeframe: 13 days (made Nov 8, 2026, target date Nov 20, 2026)
- Price at analysis: $56.29
- Price target: $54.00
- Expected range: $51.20 – $57.60
- Result: Pending — graded after the close on Nov 20, 2026
Get a free AI analysis of INTC today
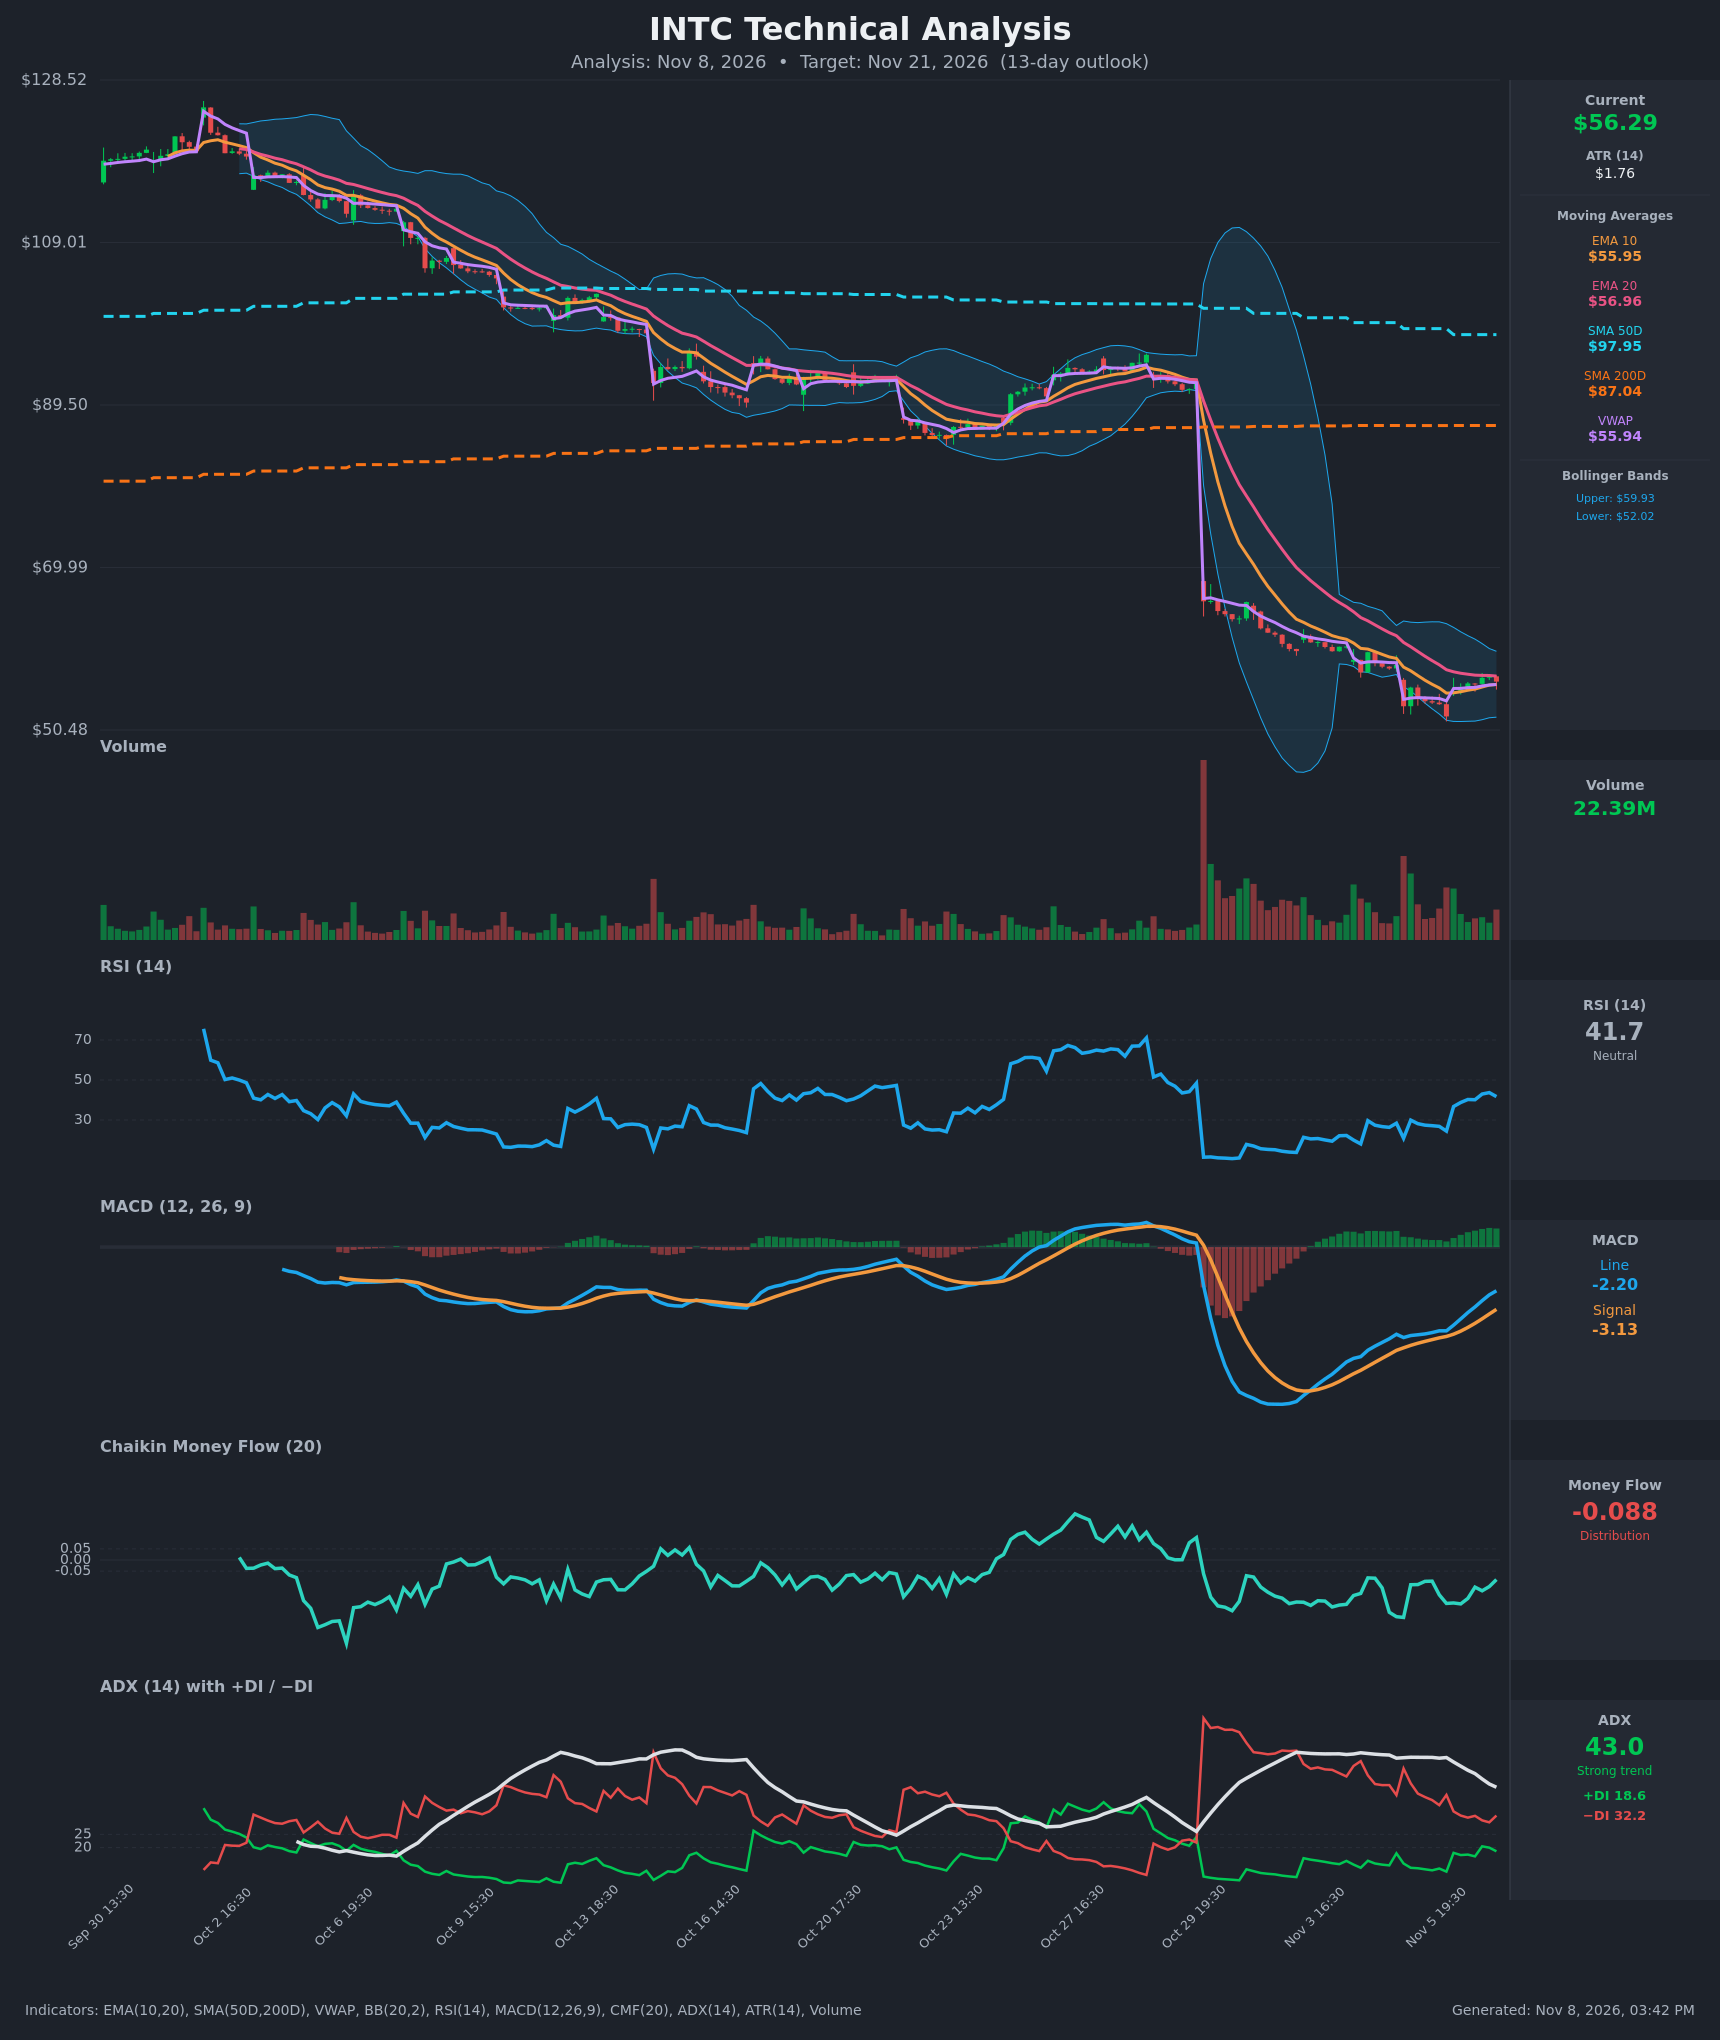
Analysis
TECHNICAL INDICATORS
- RSI (14): 41.71, up from an oversold 20.9 on Nov 5 and now back in the lower-neutral zone. Momentum is recovering, but the last bar ticked down from 43.7, and RSI has not reached the 50 midline. [Neutral]
- 20 EMA: $56.96, just above price ($56.29), so it is acting as overhead resistance. EMA10 ($55.95) is below EMA20 and price sits just above it. The EMA10/EMA20 spread is narrowing (about $1.0), but there is no bullish crossover yet. [Bearish]
- MACD: Line -2.20 is above the signal at -3.13, a histogram of about +0.93. The bullish crossover happened around Nov 5-6 and the histogram is expanding. This is a relief bounce, and the line is still deeply below zero. [Bullish]
- Bollinger Bands (20): Upper $59.93, lower $52.02, midline about $55.97. Price is near the midline, just off the Nov 5 lower-band tag. The bands have contracted sharply after the volatility spike, so there is no clear squeeze or breakout signal. [Neutral]
- CMF (20): -0.088, below the -0.05 threshold. It is improving from -0.258 but still negative, which shows ongoing distribution. Rallies are not being supported by real buying pressure. [Distribution]
- ADX (14): 43.0 with −DI (32.2) well above +DI (18.6). This is a strong downtrend. ADX has fallen from 54, so the trend is maturing and the downside momentum is easing, but the bears still control direction. [Strong Trend – Bearish]
- Volume: 22.39M on the latest bar, in line with the elevated post-gap levels and well below the spike on the Oct 29 gap. The bounce candles show no decisive volume expansion, so there is no strong conviction behind the rebound. [Neutral to Slightly Bearish]
Other levels: price is far below SMA50 ($97.95) and SMA200 ($87.04). SMA50 is above SMA200, but the chart shows price collapsing well below both, so the long-term structure is a damaged downtrend. Price is just above VWAP ($55.94), which is a minor short-term positive.
DIVERGENCES & TRENDS
- Mild bullish divergence: price made a lower low near $52.11 on Nov 5 while RSI printed a higher low (24.4 vs 20.9). MACD has also turned up sharply. This explains the current bounce.
- Trend exhaustion in ADX: ADX has dropped from 54 to 43 and −DI has retreated from 50 to 32. Selling pressure is cooling, but +DI has not crossed above −DI.
- Bounce stalling at resistance: price rose from $52.11 to $56.92 and has now slipped back to $56.29, right at the EMA20 ($56.96), with RSI rolling over from 43.7.
- CMF stays negative: it has been below zero since the Oct 29 gap, with no accumulation regime.
- Crossovers: a bullish MACD signal-line cross has occurred. There is no EMA10/20 bullish cross and no DI cross.
CHART PATTERNS
- Bearish Flag / Pennant (primary): a sharp, high-volume drop (the Oct 29 gap and follow-through) followed by a small, low-momentum rebound channel between $52 and $58. The reference diagram's continuation target is a repeat of the prior leg. A break below $52 would target roughly $48-$49.
- Bullish Double Bottom (alternative): lows near $52 on Nov 5 with a bounce since then. The neckline is around $58-$60 (the Nov 4 close and upper Bollinger Band). It is not confirmed, and a close above $60 would be needed to activate a target around $62-$64.
- With price pinned under EMA20 and in a −DI-dominated trend, the continuation (flag) read has more weight than the reversal read.
POTENTIAL SCENARIOS
- Scenario 1: Bearish Rejection at EMA20 and Trend Resumption — The relief bounce fails under the EMA20 and the downtrend resumes, with distribution (CMF) continuing and −DI staying dominant. Trigger: a close below the EMA10/VWAP zone (~$55.90) and then below $54. Target: $53.50-$54.00 first, with an extension to the $52 lower band. Invalidation: a daily close above $58.50 with CMF turning positive. (50% probability)
- Scenario 2: Bullish Double-Bottom Relief Extension — The MACD cross and RSI recovery carry price through the EMA20 and toward the upper Bollinger Band. Trigger: a close above $57.00 (EMA20) on rising volume, then $58.30. Target: $59.90-$61.00. Invalidation: a close back below $55.00. (30% probability)
- Scenario 3: Neutral Range Consolidation — Price chops between the lower band (~$52) and EMA20 (~$57) as ADX continues to cool. Trigger: failed breaks of both $52 and $57. Target: $54-$57. Invalidation: a daily close outside the $52-$58 range. (20% probability)
PRICE TARGETS
- Target Price: $54.00 (13-day target)
- Expected Range: $51.20 to $57.60. This is $6.40 wide, about 11.4% of the current price, which is within the 8-12% guidance for 14-21 days and sensible for 13 days.
- Key Levels: Support at $52.00 (lower Bollinger Band and the Nov 5 low), Resistance at $56.96 (EMA20), with a secondary ceiling at $59.93 (upper Bollinger Band)
OVERALL BIAS
OVERALL BIAS: BEARISH - Price remains in a strong ADX-confirmed downtrend (−DI 32.2 vs +DI 18.6), below its major moving averages and the EMA20, with CMF showing distribution. The MACD cross and RSI recovery support only a relief bounce, and that bounce is stalling at EMA20 resistance, which favors a drift back toward $54.
This is educational analysis and not financial advice.