META 13-day bearish forecast — Nov 8, 2026
- Bias: Bearish
- Timeframe: 13 days (made Nov 8, 2026, target date Nov 20, 2026)
- Price at analysis: $610.12
- Price target: $598.00
- Expected range: $573.00 – $630.00
- Result: Pending — graded after the close on Nov 20, 2026
Get a free AI analysis of META today
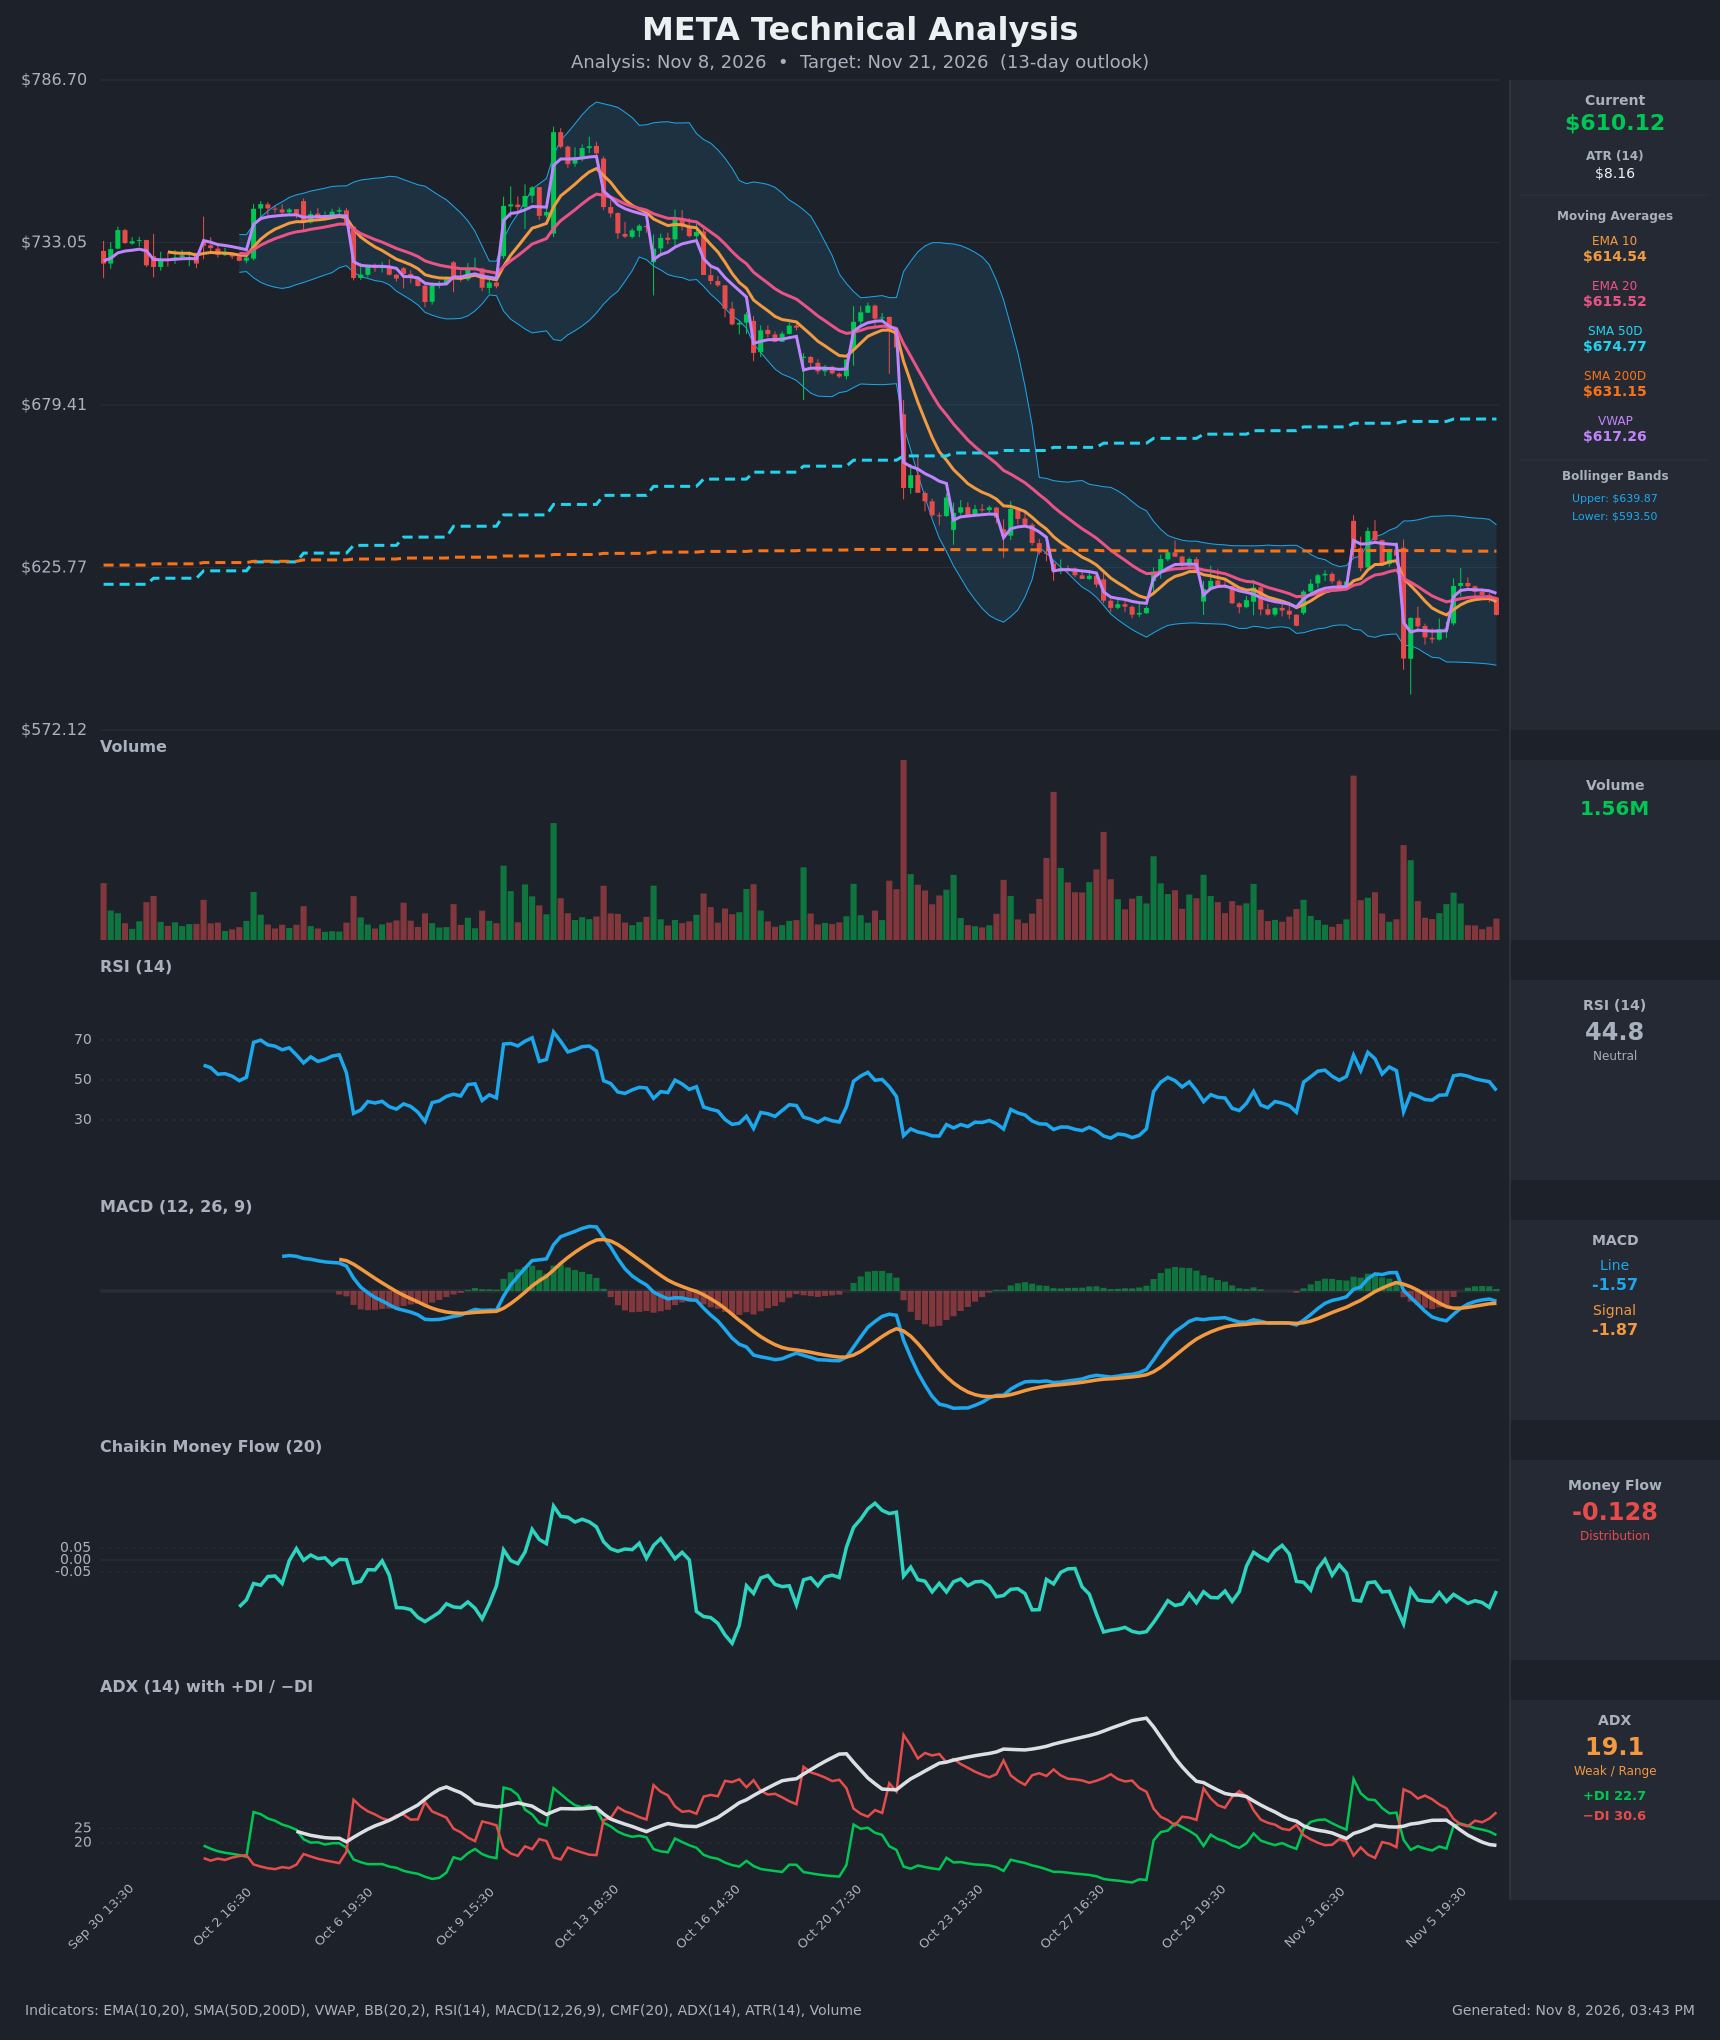
Analysis
TECHNICAL INDICATORS
- RSI (14): 44.77, down from 52.7 on Nov 6 and below the 50 midline. Momentum is rolling over, but it is nowhere near oversold (<30), so there is room to fall further. [Bearish]
- 20 EMA: $615.52, with the EMA10 at $614.54 just under it. Price at $610.12 is below both, so the cluster acts as overhead resistance. The EMA10 has dipped below the EMA20 again after a brief equal reading. [Bearish]
- MACD: Line -1.568, signal -1.871, histogram about +0.30 and shrinking from roughly +0.72 an hour or two earlier. The line is still barely above the signal after the Nov 6 bullish cross, but the gap is closing and both lines are below zero. A bearish re-cross looks likely. [Bearish]
- Bollinger Bands (20): Upper $639.87, lower $593.50, midline about $616.7. Price is in the lower half, rejected at the midline, and the bands are fairly flat. That points to a range and a pullback toward the lower band rather than a squeeze breakout. [Neutral]
- CMF (20): -0.128, well below -0.05 and negative throughout the recent bars (-0.13 to -0.26). Sustained distribution, with no accumulation despite the bounce. [Distribution]
- ADX (14): 19.1 and falling from 27.9, so the trend is weak and the market is range-bound. −DI (30.6) is above +DI (22.7) and the gap has widened over the last few bars, which gives the edge to sellers. [Weak Trend, Bearish Bias]
- Volume: 1.56M, modest and below the spikes on the Nov 5 gap-down and the Oct 20 breakdown. The selloffs carried heavier volume than the bounces. Participation is light now. [Neutral to slightly Bearish]
Moving-average context:
- Price is below the SMA200 ($631.15), a long-term bearish signal.
- Price is far below the SMA50 ($674.77).
- Price is below VWAP ($617.26).
DIVERGENCES & TRENDS
- No clear divergence. The Nov 6 bounce to $620 produced a lower high in RSI (52.7 versus the ~60s earlier in the week), which confirms weak momentum.
- Trend: The structure is a large downtrend from ~$780 to ~$600, now sideways between about $593 and $640. Price has failed to reclaim the SMA200 and keeps rejecting at the EMA cluster.
- Crossovers: The MACD histogram is fading from positive and is close to a bearish cross. The ADX is dropping below 20 while −DI stays on top. The 50/200 SMA relationship has not formed a death cross, and the SMA50 is still above the SMA200 because it lags.
- Rejection: The Nov 6 high at ~$620 fell short of the SMA200 and the upper range, and the close that followed was weak ($610.12).
CHART PATTERNS
- Bearish flag / rectangle consolidation (continuation): After the sharp decline from ~$780, price has spent weeks in a ~$593–$640 box with lower highs. Compared with the reference diagram, this looks like a bearish flag or pennant continuation, and a break below $593 would resolve it lower. The measured target for a break is roughly $565–$575, with the Nov 5 wick near $580 as intermediate support.
- Secondary read: The base could also be an early triple-bottom or double-bottom attempt, which would need a close above the SMA200 (~$631) and the $640 band top. That has not happened.
- Significance: Evidence favors the continuation reading, but the weak ADX means the break may not come within 13 days.
POTENTIAL SCENARIOS
- Scenario 1: Bearish Rejection and Test of Range Low — Price stays capped under the EMA10/20 and VWAP cluster and drifts toward the lower Bollinger Band. MACD re-crosses down, −DI stays dominant, and distribution continues. Trigger: failure to close above $616–$617, or a break below $605. Target: $593–$598 first, with an extension to $580 on a break of $593.50. Invalidation: a daily close above $631 (SMA200). (50% probability)
- Scenario 2: Neutral Range Chop — Weak ADX keeps price inside $595–$630, oscillating around the EMA cluster. Trigger: low-volume, indecisive action with RSI holding 40–55. Target: $600–$625. Invalidation: a close outside $593 or $632. (28% probability)
- Scenario 3: Bullish Reclaim of the SMA200 — Buyers push through the EMA/VWAP cluster and the SMA200, squeezing shorts toward the upper band. Trigger: a close above $617 with volume expansion and CMF turning positive. Target: $631–$640. Invalidation: a drop back below $605. (22% probability)
PRICE TARGETS
- Target Price: $598.00 (13-day outlook, about -2.0% from current)
- Expected Range: $573.00 to $630.00 (width $57, about 9.3% of current price, consistent with a ~13-day horizon)
- Key Levels: Support at $593.50 (lower Bollinger Band, with the wick low near $580 below it), Resistance at $631.15 (SMA200). The $615–$617 EMA/VWAP cluster is the nearest intermediate resistance.
OVERALL BIAS
OVERALL BIAS: BEARISH - Price sits below the EMA10/20, VWAP and SMA200 with −DI above +DI, CMF at -0.128 showing distribution, and the MACD histogram fading. A drift toward the $593 range low is the most probable path. Conviction is moderate because ADX is weak and price remains inside a range.
This is educational analysis and not financial advice.