MU 13-day bullish forecast — Nov 8, 2026
- Bias: Bullish
- Timeframe: 13 days (made Nov 8, 2026, target date Nov 20, 2026)
- Price at analysis: $689.42
- Price target: $708.00
- Expected range: $665.00 – $730.00
- Result: Pending — graded after the close on Nov 20, 2026
Get a free AI analysis of MU today
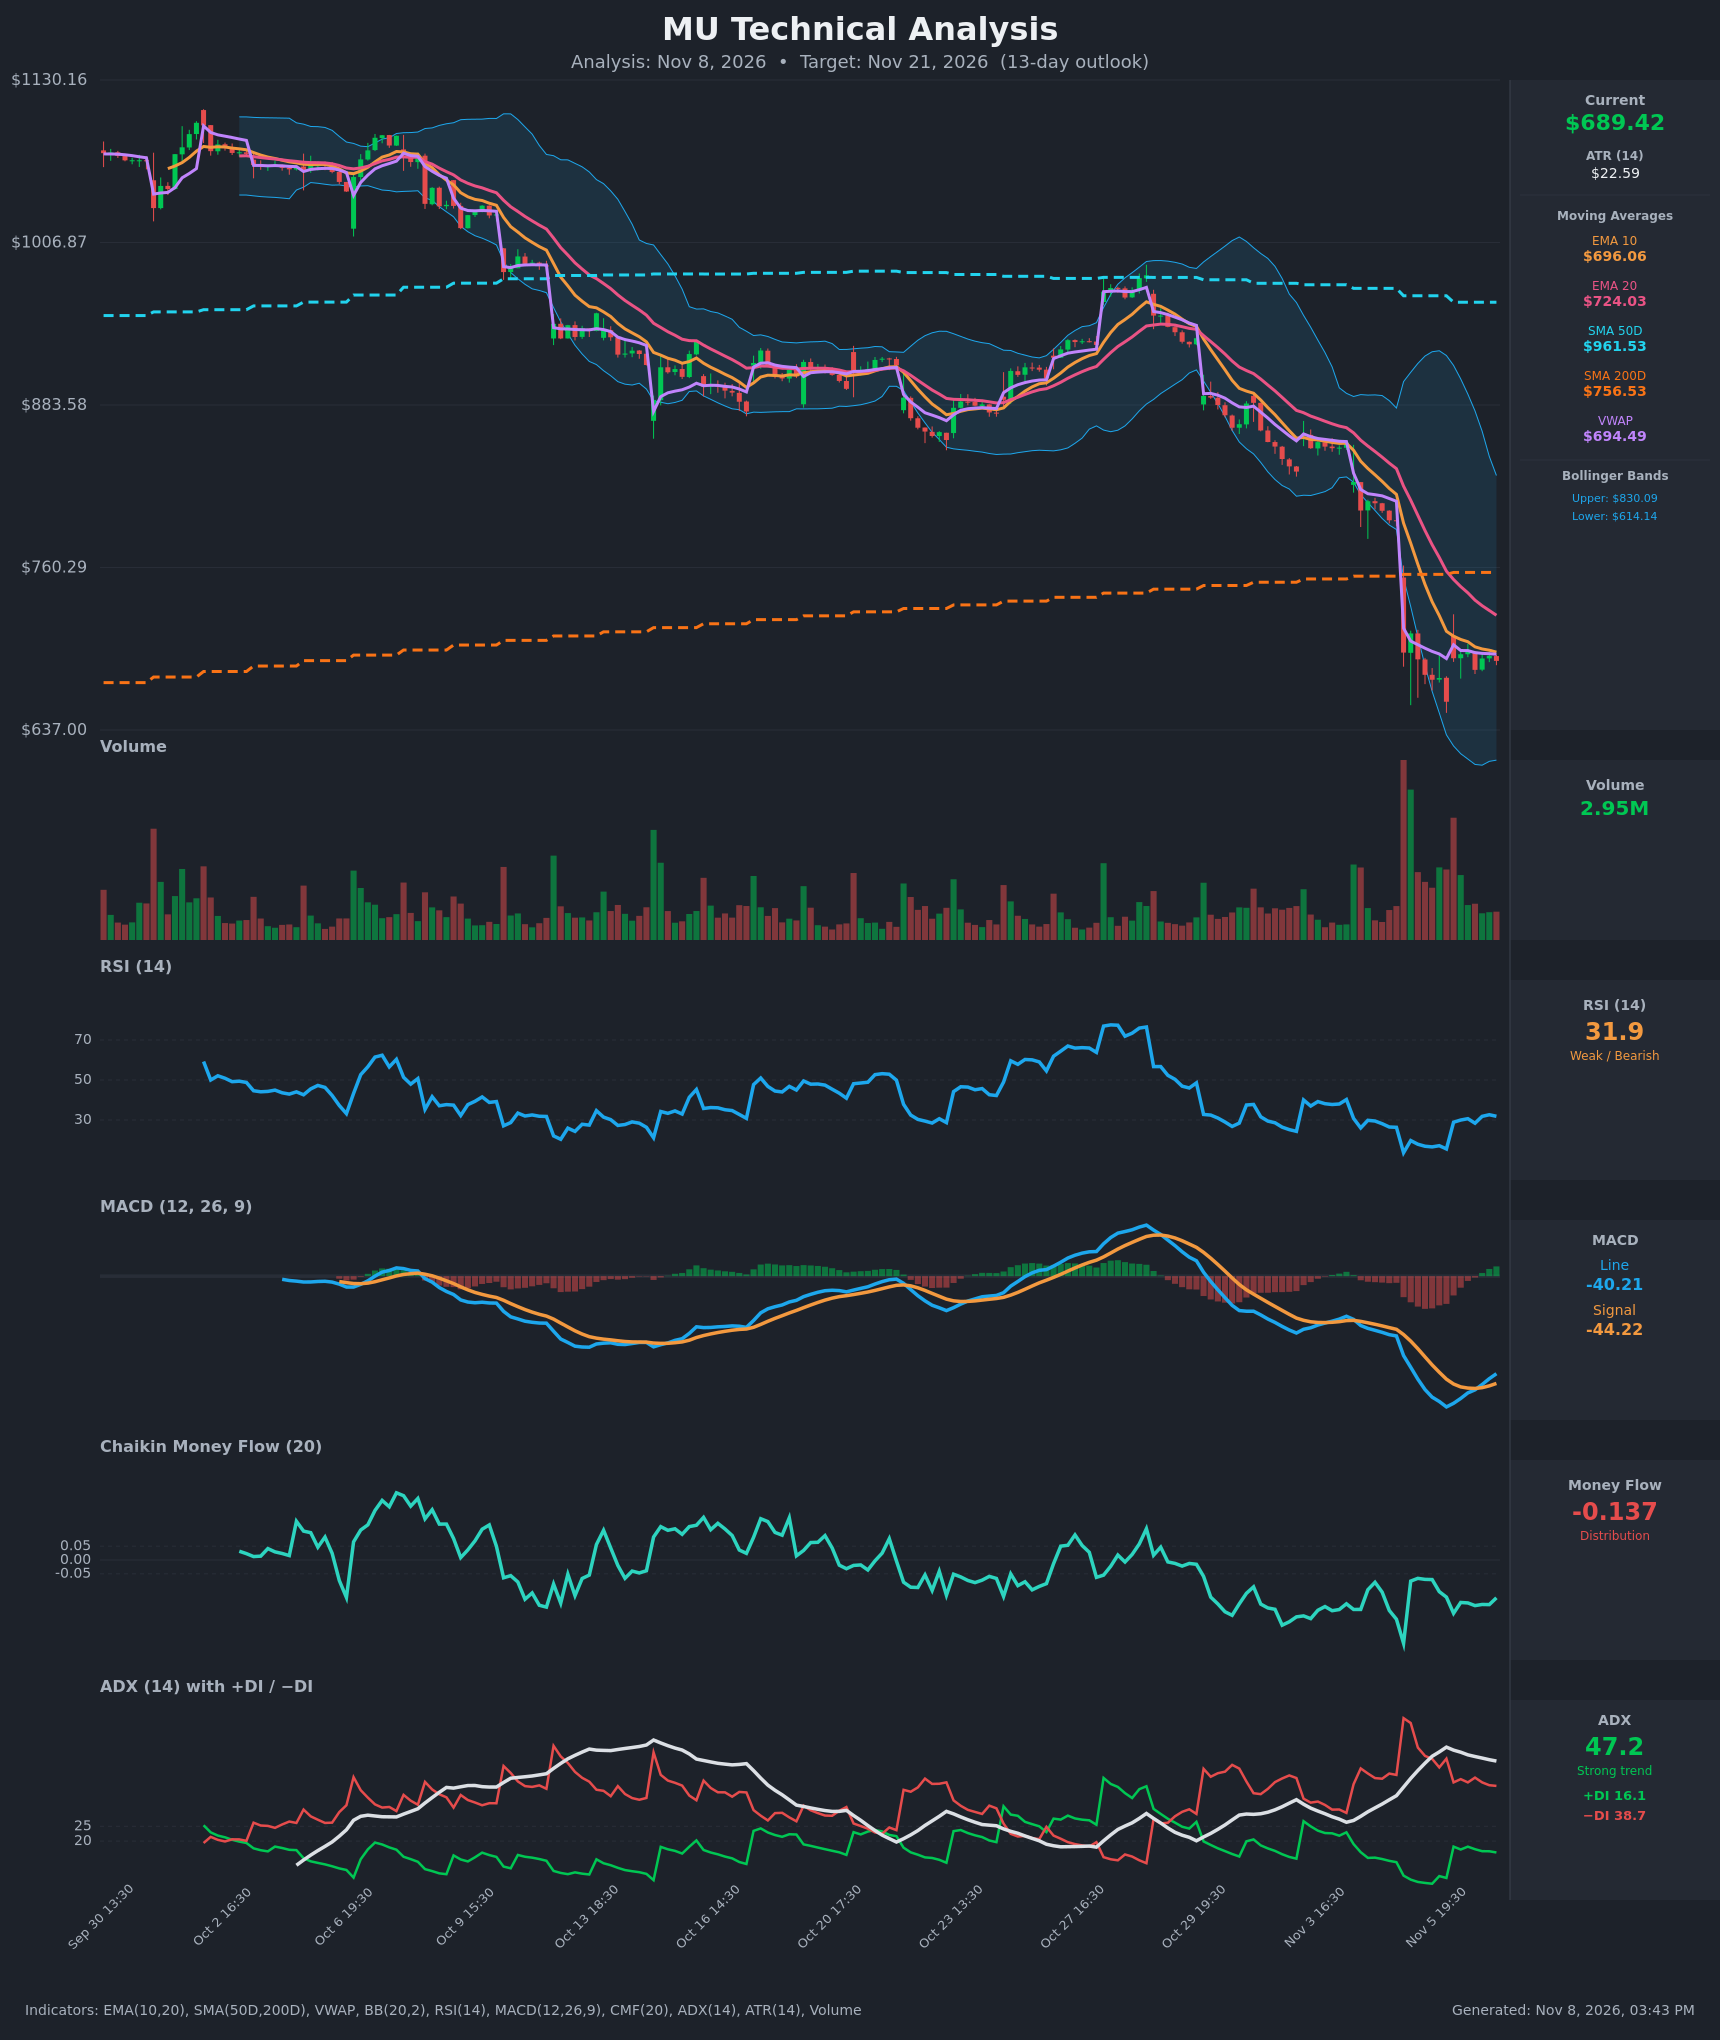
Analysis
TECHNICAL INDICATORS
- RSI (14): 31.86, just above oversold. It bottomed at 13.6-15.5 on Nov 5 and has since recovered to the high 20s and low 30s. Price made a similar low area while RSI printed a much higher low, which is early bullish divergence. Momentum is stabilizing but still weak. [Neutral]
- 20 EMA: $724.03, about 5% above price and falling. EMA10 ($696.06) is also just overhead and below EMA20, so the bearish stack is intact. Price has been rejected near EMA10 for several bars. Price is below both, so they act as resistance. [Bearish]
- MACD: Line -40.21 vs signal -44.22, a histogram of +4.0 that has been rising for six bars. The line crossed above the signal around Nov 6 18:30, a bullish crossover from deeply negative territory. This is a momentum-exhaustion signal rather than a trend reversal, since both lines are still far below zero. [Bullish]
- Bollinger Bands (20): Upper $830.09, lower $614.14, mid about $722. Price at $689 is in the lower half, well off the lower band after tagging it during the crash. The bands are very wide (about 31% of price), which signals elevated volatility. There is room for a mean-reversion bounce toward the midline, but no squeeze or breakout. [Neutral]
- CMF (20): -0.137, below the -0.05 threshold. It has been persistently negative, ranging from -0.07 to -0.30 over recent bars, so distribution continues. It has improved from the -0.30 low but shows no accumulation yet. [Distribution]
- ADX (14): 47.2 with -DI 38.7 on top of +DI 16.1. This is a very strong downtrend, but ADX has rolled over from a 51.9 peak and -DI has fallen from 61.7. The downtrend is still dominant but losing intensity. [Strong Trend - Bearish, fading]
- Volume: 2.95M, well below the huge capitulation spike on the Nov 5 gap-down, with recent bars subdued. Selling volume is drying up, consistent with a pause or base after the washout, though there is no strong buying volume yet. VWAP at $694.49 sits just above price and is acting as resistance. [Selling exhaustion, no confirmed buyers]
DIVERGENCES & TRENDS
- Bullish RSI divergence: Price is trading at or near the Nov 5 low zone ($658-$690) while RSI has lifted from about 15 to about 32.
- MACD: A bullish line/signal crossover has formed with a rising histogram, the first positive histogram bars after a long red stretch.
- ADX/DI: ADX is rolling over from its peak, and +DI has recovered from about 6 to about 16 while -DI has dropped from about 62 to about 39. Bearish momentum is decelerating but there is no DI crossover.
- Moving averages: Price is below EMA10, EMA20, VWAP and SMA200D ($756.53), and far below SMA50D ($961.53). SMA50D is still above SMA200D, so there is no death cross yet, though the gap is narrowing.
- CMF: Still negative and has not confirmed the momentum improvement. This is the main non-confirmation.
CHART PATTERNS
- Bearish Pennant/Flag (continuation): After the sharp drop from about $795 to about $658, price has stalled in a tight $675-$696 consolidation under falling EMAs. A breakdown below about $675-$658 would extend the downtrend toward the lower Bollinger Band at $614, and a measured move would reach even lower.
- Early bullish reversal traits: The RSI divergence, MACD crossover and volume exhaustion resemble a washout base. A move back above VWAP/EMA10 ($694-$696) and then EMA20 ($724) would invalidate the bearish pennant and favor a relief rally.
- Bollinger-band reference: The pattern is not a clean double bottom or inverted head-and-shoulders, so treat it as a consolidation after a capitulation gap.
POTENTIAL SCENARIOS
- Scenario 1: Bullish Relief Bounce — Oversold RSI, bullish MACD crossover and fading sell volume support a mean-reversion bounce toward the EMA20/Bollinger midline. Trigger: close above $696 (EMA10/VWAP) on rising volume. Target: $710-$724. Invalidation: close below $658. (45% probability)
- Scenario 2: Bearish Trend Continuation — The strong downtrend (ADX 47, -DI dominant, CMF negative) resumes after the pennant-like pause, with sellers defending the falling EMAs. Trigger: break below $675, then $658. Target: $625-$614 (lower Bollinger Band). Invalidation: reclaim of $724. (40% probability)
- Scenario 3: Neutral Range Chop — Price stays in $660-$725 as volatility compresses while the trend digests the crash. Trigger: failed breaks of both $658 and $724. Target: $685-$700. Invalidation: close outside $650-$735. (15% probability)
PRICE TARGETS
For the 13-day timeframe (ATR $22.59; range width about 9.4% of price, between the 7-10 day and 14-21 day guidance):
- Target Price: $708.00
- Expected Range: $665.00 to $730.00 (width $65 = about 9.4%)
- Key Levels: Support at $658.00, Resistance at $724.00
OVERALL BIAS
OVERALL BIAS: BULLISH - A bullish MACD crossover, RSI divergence off deeply oversold levels, fading ADX/-DI and exhausted selling volume favor a modest relief bounce toward EMA20 (about $724). Conviction is modest because price is still below all key moving averages and CMF shows distribution; a break under $658 would flip the view.
This is educational analysis and not financial advice.