USO 13-day bearish forecast — Nov 8, 2026
- Bias: Bearish
- Timeframe: 13 days (made Nov 8, 2026, target date Nov 20, 2026)
- Price at analysis: $148.41
- Price target: $146.00
- Expected range: $139.00 – $151.50
- Result: Pending — graded after the close on Nov 20, 2026
Get a free AI analysis of USO today
Analysis
TECHNICAL INDICATORS
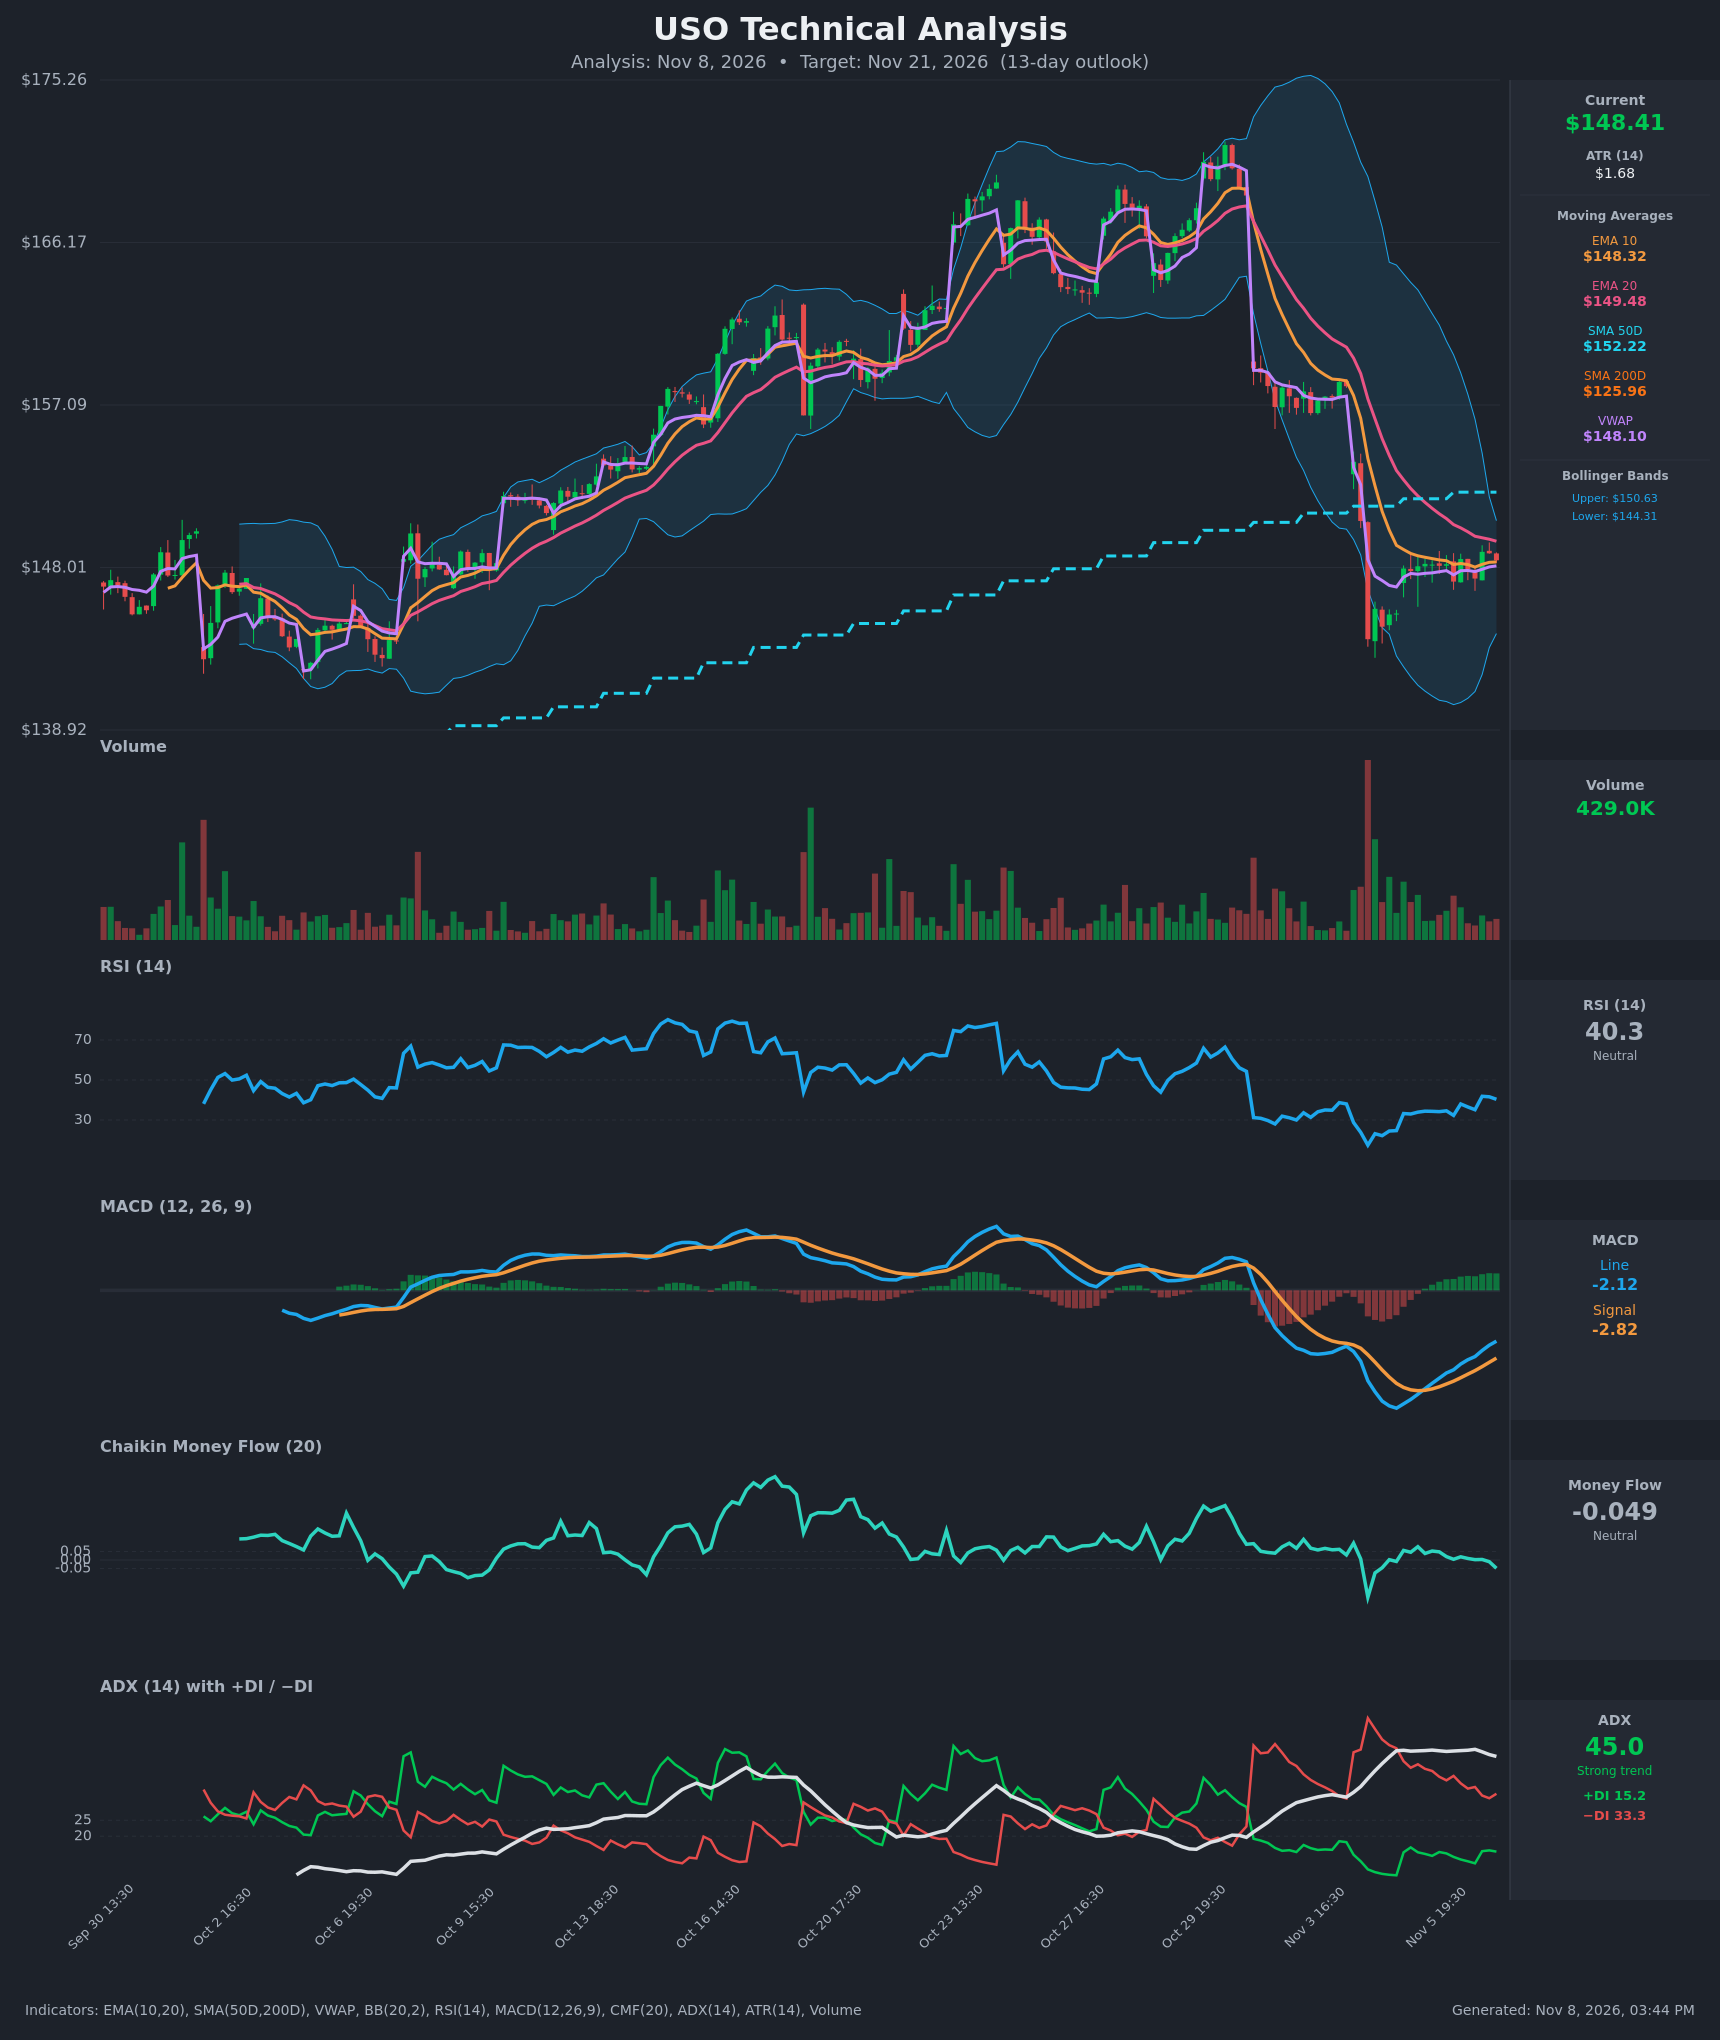
- RSI (14): 40.34. It has recovered from an oversold 24.7 on Nov 4 and sits in a 33-42 band. It is below 50 and has not regained the mid-line, so momentum is weak but stabilizing. [Bearish]
- 20 EMA: $149.48, with price ($148.41) below it. The EMA is still sloping down, so it acts as overhead resistance. EMA10 ($148.32) is below EMA20, which keeps the short-term bearish crossover in place. Price is only just above EMA10. [Bearish]
- MACD: Line -2.12 is above Signal -2.82, a bullish crossover on Nov 5-6. The histogram is positive (+0.70) and rising, but both lines are still well below zero. This is a bounce within a downtrend, not a trend reversal. [Bullish]
- Bollinger Bands (20): Upper $150.63, lower $144.31, mid-band about $147.47. Price is slightly above the mid-band and the bands are starting to contract after the sharp expansion from the selloff. That points to consolidation, with the upper band and EMA20 as the nearest resistance. [Neutral]
- CMF (20): -0.049. It has faded from slightly positive readings to the edge of distribution (-0.05). Buying pressure is not following the bounce. [Neutral]
- ADX (14): 45.0 with +DI 15.2 and −DI 33.3. This is a very strong trend with bears firmly on top. ADX is plateauing and slipping slightly from 47, so the trend is maturing, but the direction is still down. [Strong Trend - Bearish]
- Volume: 429.0K, below the capitulation spike on Nov 3-4. The sideways grind has come on average to light volume, so there is no sign of aggressive dip-buying or fresh selling. [Neutral / Consolidation]
DIVERGENCES & TRENDS
- MACD has crossed bullishly and the histogram is rising, while price is flat in a tight $147-$149 range. RSI is bouncing from oversold, but its lower highs under 42 show no real strength. This is a mild bullish momentum divergence, not yet confirmed by price or CMF.
- CMF is drifting back to -0.05 while MACD improves. That is a non-confirmation of the bounce.
- EMA10 is converging on EMA20 from below (gap narrowed from -4.2 to -1.2). A bullish EMA10/EMA20 cross is possible within days if price pushes above $149.5.
- The structure is a death-cross-like setup. SMA50D ($152.22) is far above SMA200D ($125.96), so there is no death cross, and the long-term trend is still up. Price remains well above SMA200D.
- Price is below SMA50D and EMA20 after a roughly 12% drop from the $170 area. Support from the prior breakout zone is near $144-$145.
- ADX at 45 with −DI dominant confirms the impulse down. The rising +DI from 7.7 to 15 shows selling pressure easing.
CHART PATTERNS
- Bullish Flag / Pennant (continuation, loose fit): After the sharp drop, price is forming a tight, flat consolidation. This resembles a Bearish Flag/Pennant (continuation lower) in the reference diagram, since the move before it was down.
- A Bearish Pennant fits best. The measured move from the consolidation (about $148) would project toward the low-$140s, around $141-$143, if support at $144.3 breaks.
- If price instead breaks above $150.6, that would be a failed pennant and a possible rebound toward the SMA50D at $152.2.
- Nothing in the reference set clearly indicates a full reversal. A Double Bottom is not confirmed, because the Nov 4 low at about $145 has not been retested.
POTENTIAL SCENARIOS
- Scenario 1: Bearish Pennant Breakdown and Continuation Lower — The tight consolidation resolves down with the dominant −DI and the declining EMA20 capping rallies. Trigger: close below $147 and then $144.3 (lower Bollinger Band). Target: $143.00, extending to $140-$141. Invalidation: close above $150.6 (upper band and EMA20 zone). (45% probability)
- Scenario 2: Neutral Range Consolidation — Price chops between $145 and $150 as MACD resets toward zero and ADX falls. Trigger: failure to break either $144.3 or $150.6. Target: $147-$149. Invalidation: close outside $144-$151. (25% probability)
- Scenario 3: Bullish Relief Rally to SMA50D — MACD crossover and a rising histogram lead to an EMA10/EMA20 bullish cross and a squeeze above the upper band. Trigger: close above $150.6 on rising volume. Target: $152.20-$154. Invalidation: rejection at $152 and a close back below $148. (30% probability)
PRICE TARGETS
- Target Price: $146.00 (13-day)
- Expected Range: $139.50 to $151.00. Width is $11.50, or about 7.7% of the current price, which sits at the upper end of the 7-10 day band and is wider than a 2-3 day range. It is below the 8-12% band for 14-21 days, so it is slightly narrow for 13 days. For this timeframe I would widen it to $139.00-$151.50 ($12.50, 8.4%).
- Key Levels: Support at $144.31, Resistance at $150.63
Final range after the self-check: $139.00 to $151.50 (width $12.50, about 8.4%).
OVERALL BIAS
OVERALL BIAS: BEARISH - ADX at 45 with −DI (33.3) far above +DI (15.2), price below the declining EMA20 and SMA50D, and CMF at distribution's edge. The flat consolidation looks like a bearish pennant, and the MACD bounce is happening below zero. Rallies are likely to meet resistance at $149.5-$150.6.
This is educational analysis and not financial advice.